on seconds_behind_master sleuthing

With large enough infrastructure it gets a bit more and more complicated to detect whether an incident or a problem is real systems problem or a monitoring glitch. This is a story of one such investigation.

With a sufficiently large set of machines, there’re multiple graphs/sets of data to look at to understand what is going on:

  • Group average – the easiest to look at for long term trends or system-wide problems
  • Top-N chart – our favorite for dive-ins, looking only at top offender lines (quite often part of the offender lines end up matching tier baseline)
  • Percentiles chart – knowing best performers, medians, 99% or 99.9% behavior is incredibly useful to understand medium-term dynamics and can give lots of insight where to look for problems. Is way more complicated to collect though.

Another very important property of data one looks at is collection frequency – though thousands of servers aggregated together into single chart will already provide smoothened view of what is going on, individual charts will always look way choppier, without any intermediate dots to show progression of metric. You will see that there’re lots of threads running, but it won’t explain how that built up – only longer term incidents averaged out over lots of machines will show that.

In our deployment, replication lag is very important metric of how well we’re doing – with faker in production it already means that machine (or machines) are in trouble, and usually that is either hardware trouble, or way too much workload from applications, and both problems need immediate actions.

It is even more interesting on pure flash machines – those are not supposed to lag at all, once they’re in production – unless something is really really wrong.

This is why I once I saw a group of flash-only machines reporting higher replication lag values, jumped to investigate. There could’ve been various reasons – e.g. long transactions increasing cost of write queries, and what not.

Looking at charts I saw that there’s some lag, that some machines spike to 1000+s lag values, and percentiles showed that only small amount of machines were hitting this. It was relatively interesting, that each of those machines would hit a lag spike and then behave normally afterwards again.

I tried to find a machine that was in high lag condition and check what is going on there. Listing machines with their lag values was relatively easy:

pmysql "SHOW SLAVE STATUS" | cut -f 1,34 | sort -nr -k 2,2 | head

What was odd, that each time I was running this, machines on the list were different. First thought in my mind was that some old transactions with old timestamps were showing up (that is usually a reason for odd Seconds_behind_master spikes), figuring out statements would’ve been piece of cake:

pmysql "SELECT * FROM information_schema.processlist where 
    user='system user' and info is not null and time>100"

Unfortunately, even though “SHOW SLAVE STATUS” was always showing me machines with 100s+ lag, none of that came via processlist query.

The aha! moment came when I tried to look at binlog/relaylog values – every “lagging” machine was at one of two relay log positions – 298 or 308. So, I looked at timestamps of events in relay log positions:

#120921 13:21:42 server id 22222  end_log_pos 106 
    Start: binlog v 4, server v 5.1.53-log created 120921 13:21:42
#120921 13:21:42 server id 4294967295  end_log_pos 151 
    Rotate to binary-logs.017880  pos: 81259576
#691231 16:00:00 server id 11111  end_log_pos 0 
    Rotate to binary-logs.017880  pos: 81259576
#120921 13:17:39 server id 11111  end_log_pos 0 
    Start: binlog v 4, server v 5.1.53-log created 120921 13:17:39
#120921 13:21:42 server id 11111  end_log_pos 81259647 
    Query ...

First record was relay log header (format description event), next two were rotation events with bogus (-1 and 0) values for timestamp and server_id – and binary log positions. Then we suddenly have master’s binary log header which is taken from the beginning of the binary log, with the binlog creation timestamp in it, then we have a query from the middle of binary log, with proper timestamp on it.

For the whole duration of SQL thread acting on the first query server thought it was executing events from 13:17:29 and not 13:21:42. Seconds_behind_master was telling that the gross offense of 253s replication lag was being committed, and database users were suffering.

Fortunately, it was just a MySQL status variable glitch and data integrity was completely fine, but this reminds us how important is quality monitoring and internal metrics for large environments – and how easy it is to draw wrong conclusions otherwise.

P.S. Of course, a bug was filed :)

replication prefetching revisited

Been a while since I wrote about replication work we did. Fake changes based approach was huge success, and now our prefetching has lots of coverage, where standard SELECTs cannot reach. We’re running our systems at replication pressure, where not running faker immediately results in replication lag. On busier machines Python implementation started using quite some CPU and ended up occasionally hitting GIL issues.

So, here’s the straightforward rewrite of fake changes replication prefetcher, faker. It can run 100k statements a sec, if needed. To get it, you can run:

bzr co lp:mysqlatfacebook/tools; cd faker

MySQL is bazillion times faster than MemSQL

I don’t like stupid benchmarks, as they waste my time. I don’t like stupid marketing, as it wastes my time too. Sometimes I succumb to those things, and now in return I want to waste your time a bit.

So, this MemSQL thing, written by some smart guys has been making rounds in press and technical community. Centerpiece of all the communication was:

“MemSQL, the database they have developed over the past year, is thirty times faster than conventional disk-based databases”

Though I usually understand that those claims don’t make any sense, I was wondering what did they do wrong. Apparently they got MySQL with default settings running and MemSQL with default settings running, then compared the two. They say it is a good benchmark, as it compares what users get just by installing standard packages.

That is already cheating, because systems are forced to work in completely different profiles. For example, memory used for data buffering, is essentially unbound on MemSQL, yet InnoDB has it limited to 128MB on 5.5 (and that is 16x the default setting used on 5.1).

For write benchmarks MemSQL will write out snapshot at 2G log mark, InnoDB is configured with 10MB transaction log, so it will start checkpointing pretty much immediately.

Still, for any benchmark, most important thing is durability. See, MemSQL claims that they support ACID, and durability is core part of that. MySQL’s InnoDB (I don’t assume other engines are usable) is durable by default, making sure that if it says that transaction returned ‘ok’, it is on disk and will be there after a crash. MemSQL is also “durable by default”, which means that it will write a transaction log, but it doesn’t really mean that it will hit the disk.

See, MemSQL also has “transaction-buffer” setting, which, in default “full durability mode” will asynchronously return “ok” until 128M buffer is full (or background log flusher thread writes it out). Essentially this is something similar to innodb_flush_log_at_trx_commit=2. In my opinion not durable.

What happens if you really enable full durability on MemSQL? Absolute sadness does. Apparently each commit will wait for background thread to wake up and write out transaction log. How often does background thread wake up? Every 50ms. Well, it actually does time accounting magic, to flush every 50ms, and calls very exact sleep.

Claim #1: MemSQL is 500x slower at durable transactions a second than InnoDB.

It is relatively easy to back that up – with decent RAID controller that has write-behind caching, InnoDB can easily sustain 10k transactions a second from a single thread, as it doesn’t sleep for 50ms between fsyncs. There is some commit grouping there, two threads will have 40tps, ten threads will have 200tps, but as I get to choose my own benchmark I claim that MemSQL is 500x slower at single-thread durable transaction rate.

Now that we established MySQL superiority (ha ha), let’s look at read performance. I sure agree, that it is where MemSQL should shine. I do agree, that its execution speeds for table scans are not bad – 8M rows scanned a second (for SELECT COUNT(*) query) from single thread is sure a great achievement.

To be honest, I didn’t want to spend my time in benchmarking what an in-memory database should excel at (I’m sure it does random point reads on skiplist just fine). Instead I decided to test my favorite query:

SELECT * FROM table ORDER BY id DESC LIMIT 5;

You know, the query that is all around the web – showing you heads of various lists. MySQL does that by pointing a cursor at an index position then walking record by record in index order. Not MemSQL, it will actually have to traverse whole table and sort it to return you the answer. Even “SELECT MAX(id)” does crawl whole table.

Claim #2: MemSQL is thousand times slower than MySQL. Or million times slower. At simple read queries. (I have been corrected on this – apparently indexes in MemSQL are unidirectional, so you have to define separate index for each direction you are going to read the table in).

Well, once we establish that MemSQL will have O(N) performance on some common operation, all we need is just find an N that is large enough ;-)

I don’t know how much we should be blaming MemSQL guys and how much that should be directed at journalists that were hyping on the technology. If we get back to ACID, we’d see that A for atomicity is done only at statement level and BEGIN/COMMIT are ignored. Isolation is only READ COMMITTED (difficult to have REPEATABLE READ with no real transactions). Durability is flawed, and I didn’t check C part. I got to admit, MemSQL FAQ states that “Yes, MemSQL supports fully ACID transactions”. This is on them, then.

The 80000 queries a second on MemSQL number isn’t anything impressive, compared to what modern MySQL can do (especially with HandlerSocket) – people are approaching million queries a sec there :-)

Though, definitely, for things that it is doing well, it is fastest MySQL protocol speaking thing at the moment, though it isn’t that far ahead of MySQL Cluster, and people talking to NDB are having also quite good performance (really amazing performance, that is).

I’m sure, that my both claims can be fixed with some engineering work. Write performance needs proper real time synching with group commit (there has been some great development in MySQL world about that lately too – though when binlog is involved things are way more complicated).

Read performance needs proper optimizations for most common patterns – index order reads, for example. Memory is fast, but not fast enough if high concurrency environment would need to do this over and over again. Even for what it does well, I’m somewhat sure that it wouldn’t overperform InnoDB 30x at in-memory workloads. I’m too lazy to benchmark today, but this ‘Claim #3’ is not that difficult to prove :-)

Anyway, we wouldn’t need this post if there was a decent disclosure of behaviors and proper benchmarking. Now we get multiple conflicting claims that are way too easy to spot within few minutes of testing. Way too easy.

P.S. Harrison also has discussed this on Quora

On binlogs and datacenters

Once MySQL is deployed inside a datacenter environment (i.e. forms a cloud ;-), major feature in it becomes replication. It is used to maintain hot copies, standby copies, read-only copies, invalidate external systems, replicate to external systems, etc. If this functionality is broken, datacenter is broken – components are not synchronized anymore, invalidations not done, data not consistent.

From performance perspective, replication not working properly results in unusable slaves so load cannot be spread. This results in higher load on other machines, including master (especially on master, if environment needs stronger consistency guarantees).

Judging on replication importance in MySQL deployments, it should attract performance engineering as much as InnoDB and other critical pieces. Though slave replication performance is being increased in 5.6, master side is not (well, group commit may help a bit, but not as much).

The major problem here is LOCK_log. It is a mutex that guards all MySQL log files (Update: that sentence is wrong, it is per-log-type  mutex, is not shared among different types, at is class private variable) (general query log, binary log, etc) – only one read or write can happen to any of them. Other logs aside (their impact can be minimized), binary log finds this mutex extremely problematic, because:

  • It stalls COMMITs
  • It stalls slave binary log reads

Though one can argue, that once there’re less commits, there will be less binary log and that will result in some sort of equilibrium. Unfortunately, one doesn’t get anywhere close to decent efficiency, as there’re too many situations, when LOCK_log is kept for way too long:

  • Slow binary log read (if they already got purged out of cache, highly likely)
  • Slow binary log write (if controller cache is saturated by page flush workload)
  • Slow memory allocation for larger events (on systems with malloc scalability issues)

Saturating RAID controller cache isn’t that difficult – and even if one dedicates separate disks to a separate log disk array (what a waste!), it doesn’t mean that out of the shelf hardware will support supplying separate cache for that disk array. Without a separate dedicated cache or high priority log processing one ends up blocking until disks are available for a write.

Read efficiency is a concern here too – MySQL uses statically sized buffer of 8k for all binary log reads, which means that on highly pressured system read-ahead may not work, and there will be way more I/O operations/seeks, while holding a precious mutex. Even if the operation to read the 8k page from memory buffers is very fast, slave threads will be forced to wait for other, much slower operations (a lagging slave reading yesterday’s data? high write workload?) to finish.

If binary log writes are on a separate device one can inspect the utilization on iostat. Usually there will be only one write or read outstanding, so the busy percentage shows really well how contended this resource is. A double-digit number already says that operations aren’t instant, and replication slaves can be subjected to log starvation, that is – not replicating.

From operation side solution to this is somehow obtaining a dedicated cache or fast device for binary log writes. One can simply disable write cache for the InnoDB data partition and use lots of parallel InnoDB page write threads, so that they win the fight against read threads. Using flashcache or similar technology to absorb writes can be beneficial in this case.

On the other hand, MySQL can be changed not to have giant log mutex – binary logs are append-only structures, and just guarding tail and rotation events could be enough, with additional one or two atomic variables to make sure that readers are fine.

Also, having compressed binlogs on disk would reduce the I/O pressure caused by writes or reads, as well as there’s a possible gain from not having to recompress logs for each remote reader.

Then datacenter will be happy, and datacenter users even happier.

MySQL is doomed?

Percona’s version of MySQL Conference this year was awesome, and there were some great keynotes there, I’ll high-light two of them.

One was called “Future Perfect: The Road Ahead for MySQL” and had a vendor panel of “Industry leaders from HP, Amazon Web Services, McAfee, Clustrix, and Akiban discuss the future of MySQL”.

It went like this:

BaronTheModerator: “so, what is the future for MySQL?”
HP Cloud: “Clouds!”
Amazon Web Services: “Clouds and DynamoDB/RDS!”
McAffee: “More Security!”
Clustrix: “More Scaling!”
Akiban: “More document stores!”

BaronTheModerator, “what do your customers ask for?”
HP Cloud: “Clouds!”
Amazon Web Services: “Clouds and DynamoDB/RDS!”
…

After an hour of that I already knew a lot about road ahead for MySQL, much more than after pragmatic “What Comes Next”, which covered boring things like optimizing for future hardware, compression, bla bla.

Probably the most significant part of keynotes was Brian Aker’s disclosure of his impact on MySQL ecosystem in his “The New MySQL Cloud Ecosystem”. Actually, people should know that Brian actually coined the term “MySQL Ecosystem”. Brian remembered his days as MySQL’s Director of Architecture (05:16 in the video):

So, what I think we’ve now been entering for last couple years really is actually the cloud era. And we have glued some pieces of things… It’s funny, we’re talking about… you know… I’m looking at MySQL 5.5 and look at 5.6 and I’m like yep, I remember, thats the roadmaps I wrote, ha, glad to know, I’m curious what they gonna do after 5.6. Didn’t leave many.. eh.. Cliff Notes to what goes behi… after that.

This reveals that MySQL Community and Oracle customer base are actually locked in into a stagnant software product with no future. I think you should be worried. Heh.

On InnoDB compression in production

Our latest changes have been pushed to public mysql@facebook branch, allowing this post to happen \o/

Recently we started rolling out InnoDB compression to our main database tier, and that has been a huge undertaking for multiple teams and a major test for MySQL. Nizam was sure the hero of all this work, and make sure you don’t miss his talk about it at MySQL conference.

Though MySQL manuals have quite some introduction about benefits of compression, we agree that benefits are good – in theory we can do less reads from disk, keep more data in buffer pool or flashcache and take less disk space on premium disk property. The benefits sounded so great, that our engineering team decided to disregard what Oracle has to say about workload characteristics and make it work with whatever workload we have.

There were major architectural issues – for example writing full compressed page images to transaction log is huge flaw for busy systems, and even with write behind caching on underlying hardware that ended up being bottleneck and resource hog.

Another important architectural difference for OLTP is avoiding failed compressions – which was the major CPU cost. Solution to that was adaptive padding – server tries to maintain uncompressed images at a level that would nearly always compress into smaller block sizes.

There were also various bugs that caused servers to melt down if there was even single compressed table on them, as well as numerous other compression problems to fix.

Obviously compression means much more CPU work, and that is especially costly for the replication thread – as it has way less time to be blocked on disk reads and has to spend more time compressing and decompressing. There’re two ways to approach that problem, one is doing less disk reads, other is doing less of everything else. Of course, if there’re multiple ways to solve a problem, we will approach all of them :)

Proper replication prefetching was at the core of this effort – not only it precaches table data from disk, but also decompresses pages for replication thread, as well as loads relay logs if they have been paged out already. Our newest push has few stability and performance fixes for Percona’s fake changes – apparently sibling page read-ins for InnoDB latching was nearly 95% of our replication thread I/O at some time.

The “everything else” part consisted of various CPU inefficiencies and stalls. For example, InnoDB waits for five milliseconds if it detects that other thread is already reading the compressed page – and these collisions sure happen with active prefetching and busy workloads – we constantly saw replication thread “stuck in 90ies“.

Also, InnoDB was actively double-checksumming pages when decompressing them – though checksum on disk read is sure understandable, checksumming while reading a page from buffer pool is certainly not – few % went down that direction.

There were few other evil behaviors in new code paths – e.g. malloc() was being done while holding InnoDB buffer pool mutex, escalating stalls from other places to InnoDB lockups.

We’re still trying to understand implications of uncompressed LRU heuristics – InnoDB will increase amount of pages held uncompressed if it is doing 50x more decompressions than disk reads, which on 10000 IOPS machine means around 8GB/s of decompressed data. We added the tunables, but for now it looks that some of our machines are still I/O bound and we’re not sure if that is a problem on other type of hardware.

It was a bit fun to spot that more than 2% of time was spent loading database options (yes, that db.opt file that has pretty much nothing in it) – even if they are needed for CREATE TABLE only.

Of course, more instrumentation and monitoring was necessary to understand and manage compression in production – standard InnoDB gives just some global overview, but to properly understand what is going on one needs per-table information.

There’re plenty of possible next steps for the compression future – more efficient packing,  performance improvements, different algorithms, etc – but for now we see that first phase worked out.

TL;DR: compression works for OLTP with newest mysql@facebook changes and there has been lots of fun work by our database teams.

Google :-(

For past few days (days!!!) I’m not able to log into my account at Google (except GMail, thanks for that! – Voice/Blogger/Plus/Docs/… are all broken though). I’m either getting this message:

Sorry, there seems to be a problem. The service you're looking for is temporarily unavailable. We're working hard to restore your access as soon as possible. Please try again in a few hours. Thanks for your patience.
Sorry, there seems to be a problem.

Or I’m sent to infinite redirect loop. None of their self-help pages are useful or have this error mentioned.

Apparently if you get such message, you should read this message in opposite way:

“Sorry (or you should be sorry), there seems to be a problem. This service is looking for you and you seem to be temporarily unavailable. We’re not working on this at all, it may show up on some report at the end of the year though as lost revenue, sad, we see you spent few hundred dollars on our services, so you trust us, but of course we have enough money from everyone else. You may try again in few minutes, few hours or few days, it won’t help you though. Though we appreciate your patience, you should start researching and debugging this yourself instead, thank you.”

I cleared all Google cookies on my browser and it started working. Apparently this has happened to others too.

Update: again…

on MySQL replication prefetching

For the impatient ones, or ones that prefer code to narrative, go here. This is long overdue anyway, and Yoshinori already beat me, hehe…

Our database environment is quite busy – there’re millions of row changes a second, millions of I/O operations a second and impact of that can be felt at each shard. Especially, as we also have to replicate to other datacenters, single threaded replication on MySQL becomes a real bottleneck.

We use multiple methods to understand and analyze replication lag composition – a simple replication thread state sampling via MySQL processlist helps to understand logical workload components (and work in that field yields great results), and pstack/GDB based replication thread sampling shows server internal behavior quite well too (a similar technique was used for accept thread visualisation).

The biggest problem with single replication thread is that it has to read data to execute queries (rather than applying physical page deltas, like PG or just appending to files like HBase, it does logical edits to page data) – we can observe 95% of process time at that state. As generally there’s just one outstanding data read per replication thread, other workload hitting the machine will also make replication reads slower.

Generally, the obvious way to deal with slow I/O is issue more outstanding parallel requests, and the only way to do that apart from parallel replication, is to predict what will be needed in future and try to fetch that.

Many many moons ago Paul Tuckfield discussed about the Youtube replication prefetcher – it would take write statements yet to be executed in relay logs,  convert them to SELECTs and run them before replication thread needs that data. He still says that was one of most satisfying quick hacks :-)

Maatkit (now Percona Toolkit) introduced mk-slave-prefetch (I played with it back in 2008, didn’t put it into operation at that time though), and eventually that looked like a reasonable option for prefetching statements on our database cluster.

5000 lines of Perl is not the easiest code to work with (or to debug), so the journey was quite bumpy. We got it working in some shape, eventually, but Baron, original author, has something to say about it:

Please don’t use mk-slave-prefetch on MySQL unless you are Facebook. Or at least don’t tell your friends, so they won’t use it.

Anyway, our updates rate would saturate mksp.pl if we used anything fancier on it, so it was a constant balancing act, in which looking at the code was something nobody wanted to do ;-) Still, it was (and is) helping us, so getting rid of it wasn’t possible either.

At some point in time we decided to make an experiment – what if we executed statements, then rolled them back – so I did a quick implementation of that method from scratch in Python – resulting piece of code was relatively small and fun to experiment with.

There were multiple problems with such approach – one complication was that queries were grabbing locks for the duration of the statement, and some of those locks would collide with what actual replication thread is doing. Fixing that would require immediate lock wait timeout or transaction kill for prefetcher thread – so, relatively deep dive into InnoDB. Another problem was internal InnoDB lock contention on rollbacks – that was expensive operation, and benefits of pages read in were negated by rollback segments lock contention. Fixing that is even more extensive InnoDB work (though probably some people would like their rollbacks to be efficient ;-)

At that moment we came up with the idea, that InnoDB codebase could be instrumented to not do any real work on updates – just page data in and return to the caller, and if any change accidentally slips in, commits can fail. That looked like a feasible project for the future.

At some point in time we were rolling out a new database tier for one product, which was supposed to have really high volume of changes, but all coming in a uniform format. It took less than hour (as most of the work has been done to create rollback-based one) to come up with a prototype that would efficiently extract literals from uniform statements, then use them for prefetching.

This method worked fine – at tiny fraction of resources used by mk-slave-prefetch we were preloading secondary indexes and could have relatively extensive parallelism.

Meanwhile, our main database cluster was having more and more uniform query workload, thanks to various libraries, abstractions and middleware – so a day of work on lowest hanging fruits provided relatively good coverage of the workload.

We didn’t stop mksp.pl – it still provided some coverage for various odd cases, which were time-consuming to work on manually.

There were few other problems with the new method – apparently we were targeting our SELECTs too accurately – UPDATEs were spending plenty of time in records_in_range. Additionally, optimistic update path was reading in pages that selects wouldn’t (due to inefficiency in B-Tree locking code). There were some odd reads done for INSERTs.

Also, SELECTs are using indexing less efficiently – InnoDB can pinpoint entries in secondary indexes by using PK values, yet that ability is not exposed to SQL layer, so prefetching on indexes that don’t have explicitly defined all fields within them is not that easy.

In theory, all these issues are supposed to be ‘fixed’ by fake changes concept. Percona recently implemented it in their releases, and we started experimenting with those changes. It is still not that mature concept, so we will be revisiting how things are or should be done, but for now test results are quite positive (we did some changes to reduce locking and avoid deadlock in REPLACE INTO, among other things).

I still observe I/Os done by main replication thread, so we’re not in perfect shape yet, but method seems to be working relatively well (at least it definitely speeds up replication). We still have to do lots of testing to qualify this for large-scale production, but this may allow way more write workload on our machines until we get parallel replication all around.

Our code for custom query, fake changes or rollback prefetcher can be checked out from a public repo together with other tools (oops, Bazaar doesn’t give easy access to subdirectories:

bzr co lp:mysqlatfacebook/tools; cd prefetch

Or browse it online.

P.S. There’s also Tungsten Replicator for ones who don’t want to wait for 5.6 parallel replication.

Blowing up in memory

MySQL isn’t too concerned about table handler memory usage – it will allocate row size buffer thrice per each table invocation. There’s a few year old bug discussing UNION memory usage – for each mention in an union one can allocate nearly 200k of unaccounted memory – so a megabyte sized query can consume 7GB of RAM already.

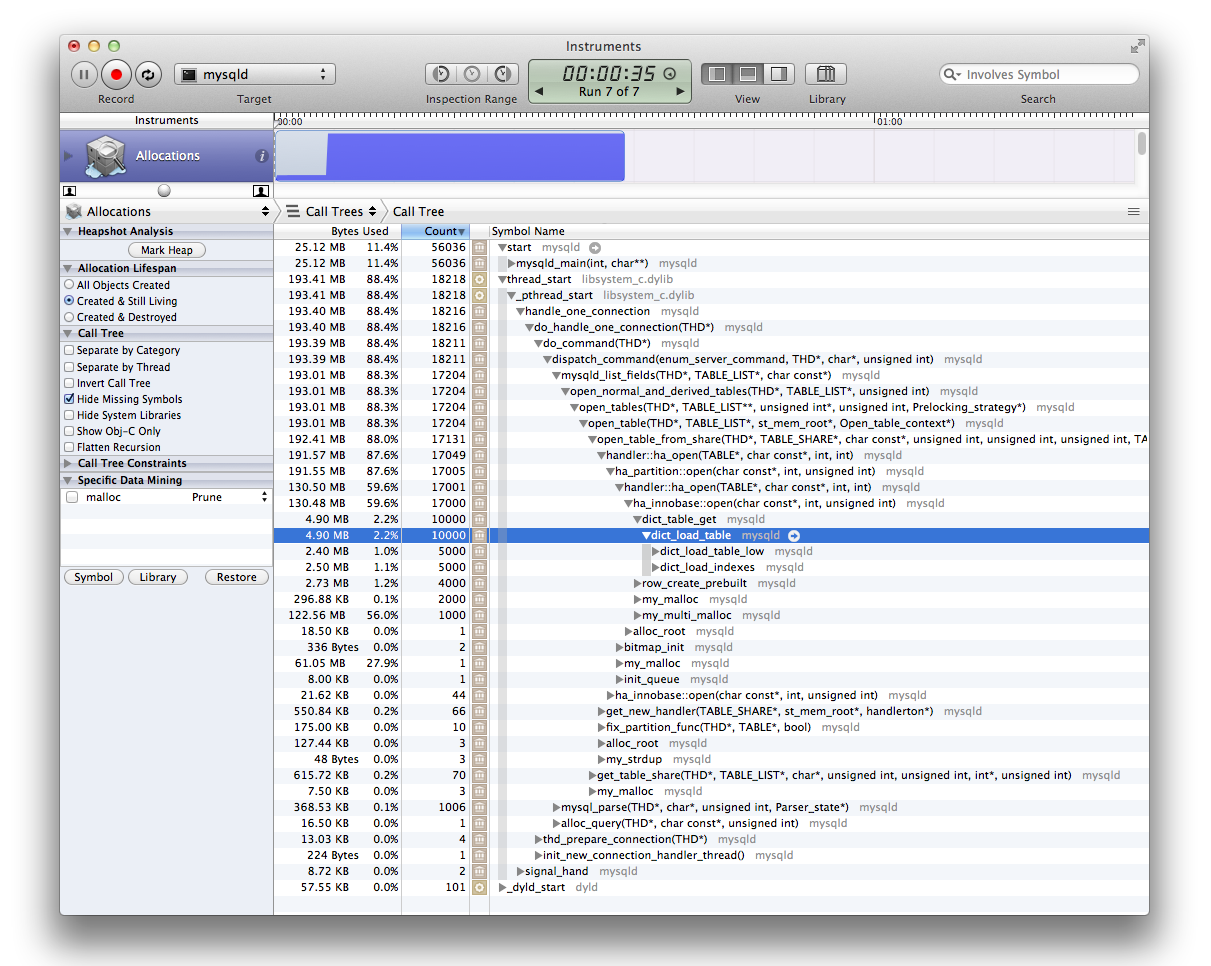
Partitioning though adds even more pain here – it will allocate those three buffers per each partition, so opening a table with 1000 partitions looks like this on memory profile:

Click to enlarge, and you will see 191MB sent to execute a simple single-row fetching query from a table (I filed a bug on this).

There’re multiple real life situations when this is painful (e.g. any kind of server stall may lead to multiple concurrent threads reading from same table, consuming additional gigabytes or tens of gigabytes of memory). It gets even more painful when combined with UNION bug – a megabyte query on an empty table can now consume 7TB of memory and I doubt anyone has that much on their MySQL servers :-)

P.S. Also, check out how much memory can be wasted for malloc overhead, once discussed here.
P.P.S. And here you can see why innodb_max_dirty_pages_pct=0 doesn’t do what you’d expect.