how innodb lost its advantage

For years it was very easy to defend InnoDB’s advantage over competition – covering index reads were saving I/O operations and CPU everywhere, table space and I/O management allowed to focus on database and not on file systems or virtual memory behaviors, and for past few years InnoDB compression was the way to have highly efficient OLTP (or in our case – SGTP – Social Graph Transaction Processing) environments. Until one day (for some it came sooner, for others later)…

InnoDB team announced that it will change how it is going to do compression in the future and that old ways (that we rely on) will be all gone. I’m not exactly sure if there was any definite messaging on the future of existing methods, but Oracle in public will never put out a roadmap, and there’s lots of uncertainty involved then. Unfortunately, with this uncertainty, we probably lost quite some momentum in InnoDB engineering efforts (we don’t get to see some of planned advancements like Nizam’s work on page reorganization).

The new way is “InnoDB Transparent PageIO Compression” – and it makes lots of sense from full-stack architecture perspective. It relies on the fact that high end flash storage devices already have a log-structured block storage internally, and if one ties directly into it, lots of overhead can be avoided (similar concepts are used by MariaDB’s atomic writes).

We were throwing this idea around as a thought exercise years ago, and we mentioned it here and there. As every thought exercise, we had lots of pros and cons to think about.

One problem is that even it is log structured internally, it is still glued together out of blocks. Few years ago disks and flash devices used to be 512-byte formatted. Nowadays industry is switching to 4k sectors (on disks it yields higher density, on flash it reduces flash translation layer (FTL) costs).

If 16k compresses into 9k, earlier assumption was that new layer will write only 9k. With 4k sectors it will actually write 12k, oh no. How do we solve that with old-style compression? We only partially fill InnoDB’s page so that we will write 8k. In this case InnoDB deciding to be naive and not do any speculative page size management ends up writing much more than solutions used at large scale environments.

Another problem is that buffer pool is no longer compressed. This may mean you will need to buy devices with more IOPS and higher write endurance. Compressed buffer pool is huge advantage, and without it users will just have to spend more on hardware (and Oracle is in selling hardware business, yay!).

Then there’s this whole other thing, which makes absolutely no sense. Why would Oracle decide to support single hardware vendor (it doesn’t even own) proprietary solution in its ubiquitous open-source product. They say they’re using APIs that work elsewhere, but thats where it is recycled bovine manure.

When you’re talking to flash device, its FTL is hiding the fact that everything is truly fragmented underneath you and the namespace it has to deal with it does not have any complicated dependencies – it is essentially log-structured K/V store, where key is block address. The ease of log structured design is that you’re writing to very few places (and you’re usually appending). General purpose file system such as XFS has to handle all the metadata between underlying flat-addressed block device and directories, file placement, extents and writes to files. On top of that it has to provide semantics like file expansion, renames, deletion, all happening on that single block device underneath.

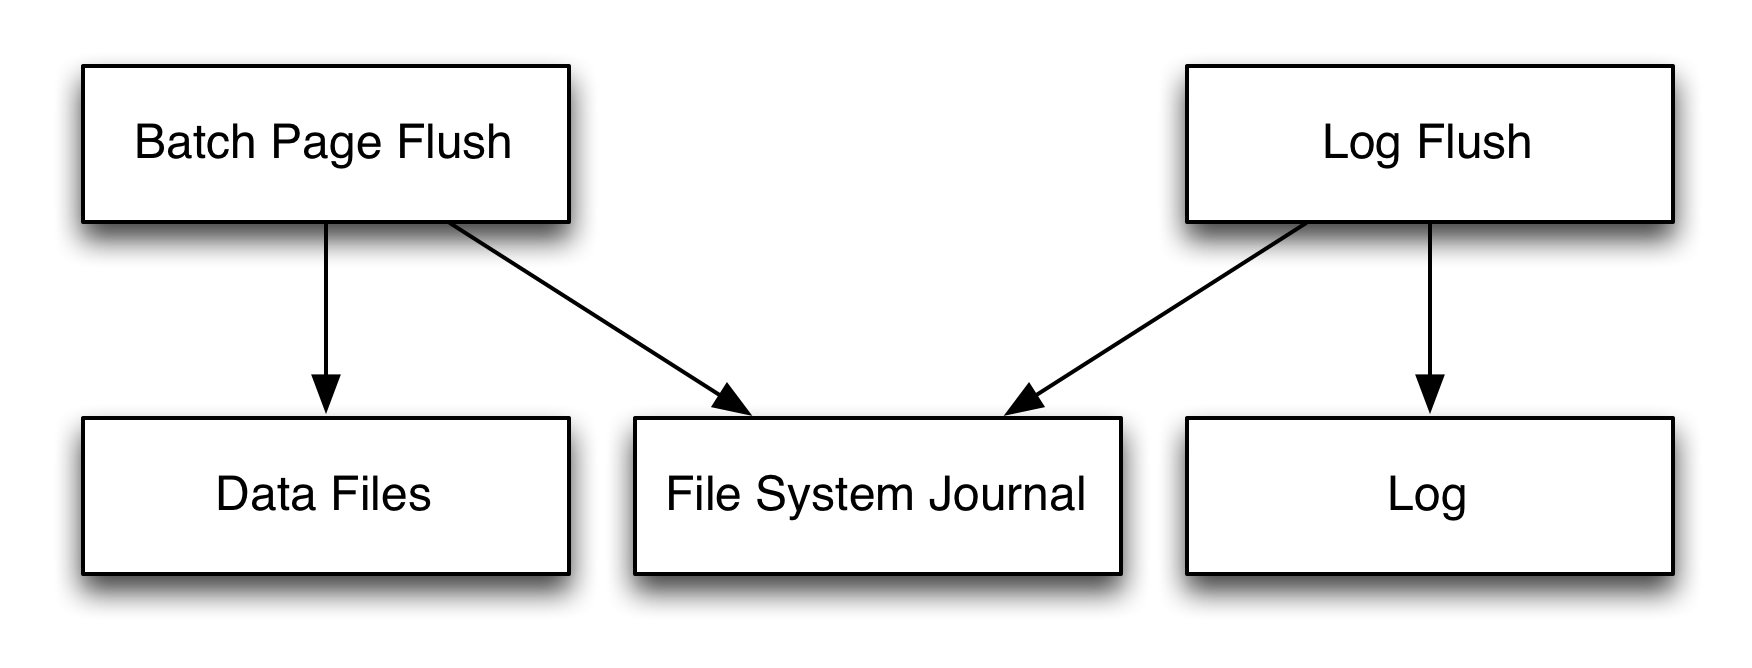
For quite a while InnoDB was holding a global mutex when extending files – and that is very trivial operation comparing to what hole punching would mean. Hole punching inside a file system would make each InnoDB page a separate segment that has to be tracked via file system metadata management (so every page write will be accompanied by filesystem journal and metadata writes). There is a question whether file system is going to scale, and then there’s just basic efficiency (a sparse synchronous write is ~5x more expensive than non-sparse one).

Dropping a file with millions of file system segments in it will take minutes of CPU time and lock contention on allocation group (each segment has to be evaluated, added back to list of free space segments with possible merging, etc). Understanding implications of extreme fragmentation (can you even use the file system once it hits 50% full? 75% full?) is not that straightforward either.

I did not have to think at all about file system scalability before (as long as writes got through), now I can’t stop noticing things like XFS padding log writes to a imaginary or real stripe size (as if every RAID is RAID5).

So while Oracle has completely messed up with InnoDB compression roadmap, surrounding industry moved ahead in leaps and bounds. Remember that toy MongoDB with all of its inefficiencies? This is where it is today:

Chasing benchmarks is not enough to win a datacenter, especially when large scale environments are working on improving efficiency of systems, not just throughput. RocksDB has been making its way into InnoDB’s turf in MySQL world, MongoDB ecosystem has RocksDB, TokuDB, WiredTiger. Embeddable InnoDB does not exist anymore, so most of innovation in storage systems ends up completely ignoring it.

While Oracle orients MySQL towards proprietary file systems and hardware devices, we will see more and more new platforms on top of open-source pluggable storage engines.

Though we did deploy recently some non-compressed InnoDB environments (I am going to talk at MySQL Conference about our MySQL/InnoDB Messenger backend), Yoshinori is going to talk about LSM databases at Facebook too and Harrison’s keynote will be about all the different systems that are needed to deal with complex data problems.

on io scheduling again

Most of database engines have to deal with underlying layers – operating systems, device drivers, firmware and physical devices, albeit different camps choose different methods.
In MySQL world people believe that InnoDB should be handling all the memory management and physical storage operations – maximized buffer pool space, adaptive/fuzzy flushing, crash recovery getting faster, etc. That can result in lots of efficiency wins, as managing everything with data problem in mind allows to tune for efficiency and performance.

Other storage systems (though I hear it from engineers on different types of problems too) like PostgreSQL or MongoDB consider OS to be much smarter and let it do caching or buffering. Which means that in top Postgres expert presentations you will hear much more about operating systems than in MySQL talks. This results in OS knowledge attrition in MySQL world (all you have to know is “use O_DIRECT, XFS and deadline scheduler”), yet Linux virtual memory behaviors and tuning are a constant issue where OS is allowed to cache or buffer.

This leads to very interesting behaviors – both PostgreSQL and MongoDB worlds have to deal with write starvation at checkpoint spikes – where no other operations can happen while data from dirty buffers is being written out to storage media. To help alleviate that instead of aiming to better managed I/O, they aim to keep less dirty pages in memory altogether. For example in Mongo world you will hear tuning recommendation to write out dirty pages once a second rather than once a minute (thus causing shorter stalls every second rather than system going dark every minute). Dirtying all the pages every second means that there is not much write merging going on and system is consuming expensive flash write cycles much faster than needed.

MySQL (and Flashcache) have demand driven checkpointing – pages are written out either if they are at the end of LRU and need to make space for fresh pages or too much log capacity is used and pages referred in oldest log events have to be synced. I prefer demand driven checkpointing much more as it means that system adapts to the workload and optimizes towards efficiency rather than performance workarounds.

So once I saw insert operations stalling for nearly a second in my tests on super-capable modern hardware (PCI-E flash, 144GB of RAM, etc), I started looking more at what can be done to eliminate such stalls. In order to be both efficient and not stall one has to do two things – reduce number of writes and prioritize important ones first. This is where the concept of “I/O scheduling” first comes to mind. As there’s lots of reliance on OS to do the right work, I looked at what exactly is being done.

From overall general perspective database workload on I/O stack looks like this:

buffered block layer


Alright, I probably could’ve done a better job at making a diagram, but my main observations here are that block layer has no idea what files you are talking to, only page reads and writes coming from various sources (threads/processes), all coming to single block device. There are some other interesting issues. For example a dirty page write is attributed not to the thread that modified the page, but the one that decided to flush it (so it is either some variant of pdflush, or userland thread calling fsync() or msync()).

So, to properly schedule things we need to inform operating system better about our intentions. The standard in database world is deadline scheduler, which separates reads and writes into separate queues and thats about it – it does not try to distinguish different types of writes coming from different sources. CFQ is much more complicated and allows to put different threads into different classes (realtime, best effort or idle) and priorities. Unfortunately, even if I attribute workloads correctly with I/O scheduling properties I hit another issue:

buffered block layer log


My two threads, one that has to get through ASAP in order not to stall system operations is actually stalling not because it cannot write its data soon enough, but because shared resource (file system journal) is being written (and delayed by scheduler) by idle or best-effort workloads.

There are two ways to deal with this, one is instructing file system to behave nicely and write its own journal with realtime scheduling, as otherwise it will stall other parts, or much simpler one – put transaction journal onto a separate file system (I can hear millions of “I told you so” voices, all forgetting that e.g. MongoDB does not even have configuration option where to put the journal and you have to hack your way around with symbolic links).

Obviously putting on completely independent device would also make sure that I/O scheduling is a non-issue too, but having multiple independent devices costs money, so we will have to still think about how to schedule things properly.

One would think that CFQ suddenly should be much more appealing as it allows to specify workload properties but the way it behaves is not exactly predictable. What one needs is much more straightforward rule set – don’t starve logs, don’t starve reads, allow other stuff to be drained eventually.

Technically, some of scheduling decisions can be simply be made by logical block addresses that get accessed (e.g. file system journal or DBMS transaction log) – and not by which thread is doing it – but interfaces to do that now are nonexistent.

There has been some interesting IO scheduler development at Taobao – they created FusionIO-oriented cgroups capable “tiny parallel proportion scheduler” for their MySQL workloads, that makes lots of sense in multi-tenant environments, but doesn’t yet address the problem of I/O starvation within same process that MongoDB has.

Currently if one wants to run Mongo or PG with perfect p99 (or pmax) behaviors, CFQ does not fully provide decent guarantees even with separate filesystems, and deadline is too limited in its scope. There should be more innovation in how user-land / file system / block layer cooperation should look like, rather than assuming that throwing hardware at the problem (or ignoring bad quality) is good enough.

That may be useful in InnoDB world some day too – I have seen issues where asynchronous batch write or read-ahead IO coming from many threads had capabilities to starve other workloads.

I tried some easy way out in some of the cases – currently MongoDB flushes one file at a time sequentially by calling msync() – which means up to 2GB flushes with default configuration or 512MB with “smallfiles” option. What one needs is much more predictable behavior, such as “flush 10MB at a time, wait for that to complete”. As it is not exactly tracked internally which pages are dirty and which are not, there is no way to provide that kind of throttling with current OS interfaces.

Though MongoDB already uses mincore() system call to check whether a page is cached in memory, there is no way yet to find out whether page is actually dirty (there have been LKML threads about providing that information). If there was an easy interface to get maps of dirty data from OS, database software would be able to schedule less aggressive writes without relying upon perfect I/O scheduler behavior.

P.S. Yes, I just blogged about MongoDB performance, albeit Mark Callaghan has been doing it for a while.

how MySQL engineering broke the backups

MySQL has exceptional track of record by introducing minor fixes that cause major breakages. Though usually I could blame naiveté of engineers, who did not really ever have to deal with production implications, but lately I can start sensing various business implications against open-source offerings.

As an original author of mydumper I really cannot get out of my mind that 5.5 and 5.6 metadata locking changes are there to screw with anyone who is building a backup solution using stable snapshot views of MySQL (for example, mysqldump –single-transaction, the golden standard of backing things up in MySQL world).

As seen in a bug #71017 (palindrome!) filed by my esteemed colleague Eric, newly introduced behaviors gobble all the locks possible, even if it makes absolutely no sense for backup/ETL/migration/etc scenarios. 

The only supported way out of that is using MySQL Enterprise Backup, which is proprietary software, and does not produce logical backups that allow selective data restores or ETL capabilities or anything else. You get complete vendor lock in where there is no way to get your data out of the system in a consistent manner, unless, of course, you restrict to “no metadata changes allowed in production” mode. 

On InnoDB compression in production

Our latest changes have been pushed to public mysql@facebook branch, allowing this post to happen \o/

Recently we started rolling out InnoDB compression to our main database tier, and that has been a huge undertaking for multiple teams and a major test for MySQL. Nizam was sure the hero of all this work, and make sure you don’t miss his talk about it at MySQL conference.

Though MySQL manuals have quite some introduction about benefits of compression, we agree that benefits are good – in theory we can do less reads from disk, keep more data in buffer pool or flashcache and take less disk space on premium disk property. The benefits sounded so great, that our engineering team decided to disregard what Oracle has to say about workload characteristics and make it work with whatever workload we have.

There were major architectural issues – for example writing full compressed page images to transaction log is huge flaw for busy systems, and even with write behind caching on underlying hardware that ended up being bottleneck and resource hog.

Another important architectural difference for OLTP is avoiding failed compressions – which was the major CPU cost. Solution to that was adaptive padding – server tries to maintain uncompressed images at a level that would nearly always compress into smaller block sizes.

There were also various bugs that caused servers to melt down if there was even single compressed table on them, as well as numerous other compression problems to fix.

Obviously compression means much more CPU work, and that is especially costly for the replication thread – as it has way less time to be blocked on disk reads and has to spend more time compressing and decompressing. There’re two ways to approach that problem, one is doing less disk reads, other is doing less of everything else. Of course, if there’re multiple ways to solve a problem, we will approach all of them :)

Proper replication prefetching was at the core of this effort – not only it precaches table data from disk, but also decompresses pages for replication thread, as well as loads relay logs if they have been paged out already. Our newest push has few stability and performance fixes for Percona’s fake changes – apparently sibling page read-ins for InnoDB latching was nearly 95% of our replication thread I/O at some time.

The “everything else” part consisted of various CPU inefficiencies and stalls. For example, InnoDB waits for five milliseconds if it detects that other thread is already reading the compressed page – and these collisions sure happen with active prefetching and busy workloads – we constantly saw replication thread “stuck in 90ies“.

Also, InnoDB was actively double-checksumming pages when decompressing them – though checksum on disk read is sure understandable, checksumming while reading a page from buffer pool is certainly not – few % went down that direction.

There were few other evil behaviors in new code paths – e.g. malloc() was being done while holding InnoDB buffer pool mutex, escalating stalls from other places to InnoDB lockups.

We’re still trying to understand implications of uncompressed LRU heuristics – InnoDB will increase amount of pages held uncompressed if it is doing 50x more decompressions than disk reads, which on 10000 IOPS machine means around 8GB/s of decompressed data. We added the tunables, but for now it looks that some of our machines are still I/O bound and we’re not sure if that is a problem on other type of hardware.

It was a bit fun to spot that more than 2% of time was spent loading database options (yes, that db.opt file that has pretty much nothing in it) – even if they are needed for CREATE TABLE only.

Of course, more instrumentation and monitoring was necessary to understand and manage compression in production – standard InnoDB gives just some global overview, but to properly understand what is going on one needs per-table information.

There’re plenty of possible next steps for the compression future – more efficient packing,  performance improvements, different algorithms, etc – but for now we see that first phase worked out.

TL;DR: compression works for OLTP with newest mysql@facebook changes and there has been lots of fun work by our database teams.

Blowing up in memory

MySQL isn’t too concerned about table handler memory usage – it will allocate row size buffer thrice per each table invocation. There’s a few year old bug discussing UNION memory usage – for each mention in an union one can allocate nearly 200k of unaccounted memory – so a megabyte sized query can consume 7GB of RAM already.

Partitioning though adds even more pain here – it will allocate those three buffers per each partition, so opening a table with 1000 partitions looks like this on memory profile:

Click to enlarge, and you will see 191MB sent to execute a simple single-row fetching query from a table (I filed a bug on this).

There’re multiple real life situations when this is painful (e.g. any kind of server stall may lead to multiple concurrent threads reading from same table, consuming additional gigabytes or tens of gigabytes of memory). It gets even more painful when combined with UNION bug – a megabyte query on an empty table can now consume 7TB of memory and I doubt anyone has that much on their MySQL servers :-)

P.S. Also, check out how much memory can be wasted for malloc overhead, once discussed here.
P.P.S. And here you can see why innodb_max_dirty_pages_pct=0 doesn’t do what you’d expect.

InnoDB subsystems in color

I tried to put every subdirectory of InnoDB codebase into a chart that would explain some of relations between subsystems and modules inside the source. This is what I got (click to enlarge):

Update: Check Vadim’s diagram for a more operational view of InnoDB
Another update: There’s a vector PDF version

InnoDB locking makes me sad

Vadim and others have pointed at the index->lock problems before, but I think they didn’t good job enough at pointing out how bad it can get (the actual problematic was hidden somewhere as some odd edge case). What ‘index lock’ means is generally the fact that InnoDB has table-level locking which will kill performance on big tables miserably.

InnoDB is a huge pie of layers, that have various locking behaviors, and are layered on top of each other, and are structured nicely as subdirectories in your innodb_plugin directory. Low level storage interfaces are done via os/ routines, then on top of that there’s some file space manager, fsp/, which allocates space for btr/ to live in, where individual page/ entities live, with multiple row/ pieces. There’re few other subsystems around, that got quite some attention lately – e.g. buf/ pool, transaction log/, and large trx/ transactions are composed of micro transactions living in mtr/.

If you live in memory, you care about buffer pool and transaction log performance, if you write insane amounts of data to in-memory buffers you hit mtr/ problems and depend o how fast you can write out log/ or flush out buf/. If you are in I/O-heavy land most of stuff you care about happens in btr/.

Generally InnoDB is quite good about read scalability in I/O bound environments – nowadays one can saturate really fast I/O devices and there will be plenty of parallel reads done. Major scalability problem in this field was read-ahead which was funneling all read-ahead activity into a small set of threads, but other than that there can be hundreds of parallel reads issued to underlying devices. Situation changes when writes are added to the mix, though again, there’re few different scenarios.

There’re two ways for InnoDB to write out updates to pages, “optimistic” and “pessimistic”. Optimism here means that only in-page (page/row) operation will be needed without changing the tree structure. In one case you can expect quite high parallelism – multiple pages can be read for that operation at a time, multiple of them can be edited at a time, then some serialization will happen while writing out changes to redo log and undo segments. Expect good performance.

The much worse case is when B-Tree is supposed to be reorganized and multiple page operations can happen; thats pessimism. In this case whole index gets locked (via a read-write lock obtained from dict/),
then B-Tree path is latched, then changes are done, then it is all unlocked until next row operation needs to hit the tree. Unfortunately, both ‘path is latched’ and ‘changes are done’ are expensive operations, and not only in-core, but are doing sync page read-ins, one at a time, which on busy systems serving lots of read load are supposed to be slow. Ironically, as no other operations can happen on the table at that time, you may find out you have spare I/O capacity.. ;-)

What gets quite interesting though is the actual operation needed to latch b-tree path. Usual wisdom would say that if you want to change a row (read-modify-write), you probably looked up the page already, so there won’t be I/O. Unfortunately, InnoDB uses an slightly more complicated binary tree version, where pages have links to neighbors, and tree latching does this (a bit simplified for reading clarity):


/* x-latch also brothers from left to right */
get_block = btr_block_get(space, zip_size, left_page_no, RW_X_LATCH, mtr);
get_block = btr_block_get(space, zip_size, page_no, RW_X_LATCH, mtr);
get_block = btr_block_get(space, zip_size, right_page_no, RW_X_LATCH, mtr);

So, essentially in this case, just because InnoDB is being pessimistic, it reads neighboring blocks to lock them, even if they may not be touched/accessed in any way – and bloats buffer pool at that time with tripple reads. It doesn’t cost much if whole tree fits in memory, but it is doing three I/Os in here, if we’re pessimistic about InnoDB being pessimistic (and I am). So, this isn’t just locking problem – it is also resource consumption problem at this stage.

Now, as the dictionary lock is hold in write mode, not only updates to this table stop, but reads too – think MyISAM kind of stop. Of course, this ‘table locking’ happens at entirely different layer than MyISAM. In MyISAM it is statement-length locking whereas in InnoDB this lock is held just for row operation on single index, but if statement is doing multiple row operations it can be acquired multiple times.

Probably there exist decent workarounds if anyone wants to tackle this – grabbing read locks on the tree while reading pages into buffer pool, then escalating lock to exclusive. A bit bigger architectural change would be allowing to grab locks on neighbors (if they are needed) without bringing in page data into memory – but that needs InnoDB overlords to look at it. Talk to your closest MySQL vendor and ask for a fix!

How do regular workloads hit this? Larger your records are, more likely you are to have tree changes, lower your performance will be. In my edge case I was inserting 7k sized rows – even though my machine had multiple disks, once the dataset fell out of buffer pool, it couldn’t insert more than 50 rows a second, even though there were many disks idle and capacity gods cried. It gets worse with out-of-page blobs – then every operation is pessimistic.

Of course, there’re ways to work around this – usually by taking the hit of sharding/partitioning (this is where common wisdom of “large tables need to be partitioned” mostly comes from). Then, like with MyISAM, one will have multiple table locks and there may be some scalability then.

TL;DR: InnoDB index lock is major architectural performance flaw, and that is why you hear that large tables are slower. There’s a big chance that there’re more scalable engines for on-disk writes out there, and all the large InnoDB write/insert benchmarks were severely hit by this.

Update: Filed bugs #61735 and #61736 with MySQL

MySQL metrics for read workloads

There are multiple metrics that are really useful for read workload analysis, that should all be tracked and looked at in performance-critical environments.

The most commonly used is of course Questions (or ‘Queries’, ‘COM_Select’) – this is probably primary finger-pointing metric that can be used in communication with different departments (“why did your qps go up by 30%?”) – it doesn’t always reveal actual cost, it can be increase of actual request rates, it can be new feature, it can be fat fingers error somewhere in the code or improperly handled cache failure.

Another important to note is Connections – MySQL’s costly bottleneck. Though most of users won’t be approaching ~10k/s area – at that point connection pooling starts actually making sense – it is worth to check for other reasons, such as “maybe we connect when we shouldn’t”, or needlessly reconnect, or actually should start looking more at thread cache performance or pooling options. There’re some neighboring metrics like ‘Bytes_sent’ – make sure you don’t hit 120MB/s on a gigabit network :-)

Other metrics usually are way more about what actually gets done. Major query efficiency signal for me for a long time used to be Innodb_rows_read. It is immediately pointing out when there are queries which don’t use indexes properly or are reading too much data. Gets a bit confusing if logical backup is running, but backup windows aside, this metric is probably one that is easy enough to track and understand. It has been extremely helpful to detect query plans gone wrong too – quite a few interesting edge cases could be resolved with FORCE INDEX (thats a topic for another post already :-)

For I/O heavy environments there’re few metrics that show mostly the same – Innodb_buffer_pool_reads, Innodb_data_reads, Innodb_pages_read – they all show how much your requests hit underlying storage – and higher increases ask for better data locality, more in-memory efficiency (smaller object sizes!) or simply more RAM/IO capacity.

For a long time lots of my metrics-oriented performance optimization could be summed up in this very simple ruleset:

  • Number of rows shown to user in the UI has to be as close as possible to rows read from the index/table
  • Number of physical I/Os done to serve rows has to be as close to 0 as possible :-)

Something I like to look at is the I/O queue size (both via iostat and from InnoDB’s point of view) – Innodb_data_pending_reads can tell how loaded your underlying storage is – on rotating media you can allow multiples of your disk count, on flash it can already mean something is odd. Do note, innodb_thread_concurrency can be a limiting factor here.

Overloads can be also detected from Threads_running – which is easy enough to track and extremely important quality of service data.

An interesting metric, that lately became more and more important for me is Innodb_buffer_pool_read_requests. Though it is often to use buffer pool efficiency in the ratio with ‘buffer pool reads’, it is actually much more interesting if compared against ‘Innodb_rows_read’. While Innodb_rows_read and Handler* metrics essentially show what has been delivered by InnoDB to upper SQL layer, there are certain expensive operations that are not accounted for, like index estimations.

Though tracking this activity helps I/O quite a bit (right FORCE INDEX reduces the amount of data that has to be cached in memory), there can be also various edge cases that will heavily hit CPU itself. A rough example could be:

SELECT * FROM table WHERE parent_id=X and type IN (1,2,4,6,8,…,20) LIMIT 10;

If there was an index on (parent_id,type) this query would look efficient, but would actually do range estimations for each type in the query, even if they would not be fetched anymore. It gets worse if there’s separate (type) index – each time query would be executed, records-in-rage estimation would be done for each type in IN() list – and usually discarded, as going after id/type lookup is much more efficient.

By looking at Innodb_buffer_pool_read_requests we could identify optimizer inefficiency cases like this – and FORCE INDEX made certain queries 30x faster, even if we forced exactly same indexes. Unfortunately, there is no per-session or per-query metric that would do same – it could be extremely useful in sample based profiling analysis.

Innodb_buffer_pool_read_requests:Innodb_rows_read ratio can vary due to multiple reasons – adaptive hash efficiency, deeper B-Trees because of wide keys (each tree node access will count in), etc – so there’s no constant baseline everyone should adjust to.

I deliberately left out query cache (here’s the reason), or adaptive hash (I don’t fully understand performance implications there :). In mysql@facebook builds we have some additional extremely useful instrumentation – wall clock seconds per various server operation types – execution, I/O, parsing, optimization, etc.

Of course, some people may point out that I’m writing here from a stone age, and that nowadays performance schema should be used. Maybe there will be more accurate ways to dissect workload costs, but nowadays one can spend few minutes looking at metrics mentioned above and have a decent understanding what the system is or should be doing.

Logs memory pressure

Warning, this may be kernel version specific, albeit this kernel is used by many database systems

Lately I’ve been working on getting more memory used by InnoDB buffer pool – besides obvious things like InnoDB memory tax there were seemingly external factors that were pushing out MySQL into swap (even with swappiness=0). We were working a lot on getting low hanging fruits like scripts that use too much memory, but they seem to be all somewhat gone, but MySQL has way too much memory pressure from outside.

I grabbed my uncache utility to assist with the investigation and started uncaching various bits on two systems, one that had larger buffer pool (60G), which was already being sent to swap, and a conservatively allocated (55G) machine, both 72G boxes. Initial finds were somewhat surprising – apparently on both machines most of external-to-mysqld memory was conserved by two sets of items:

  • binary logs – write once, read only tail (sometimes, if MySQL I/O cache cannot satisfy) – we saw nearly 10G consumed by binlogs on conservatively allocated machines
  • transaction logs – write many, read never (by MySQL), buffered I/O – full set of transaction logs was found in memory

It was remarkably easy to get rid of binlogs from cache, both by calling out ‘uncache’ from scripts, or using this tiny Python class:

libc = ctypes.CDLL("libc.so.6")
class cachedfile (file):
    FADV_DONTNEED = 4
    def uncache(self):
        libc.posix_fadvise(self.fileno(), 0, 0, self.FADV_DONTNEED)

As it was major memory stress source, it was somewhat a no brainer that binlogs have to be removed from cache – something that can be serially re-read is taking space away from a buffer pool which avoids random reads. It may make sense to call posix_fadvise() right after writes to them, even.

Transaction logs, on the other hand, are entirely different beast. From MySQL perspective they should be uncached immediately, as nobody ever ever reads them (crash recovery aside, but re-reading then is relatively cheap, as no writes or random reads are done during log read phase). Unfortunately, the problem lies way below MySQL, and thanks to PeterZ for reminding me (we had a small chat about this at Jeremy’s Silicon Valley MySQL Meetup).

MySQL transaction records are stored in multiple log groups per transaction, then written out as per-log-group writes (each is in multiple of 512 bytes), followed by fsync(). This allows FS to do transaction log write as single I/O operation. This also means that it will be doing partial page writes to buffered files – overwriting existing data in part of the page, so it has to be read from storage.

So, if all transaction log pages are removed from cache, quite some of them will have to be read back in (depending on sizes of transactions, probably all of them in some cases). Oddly enough, when I tried to hit the edge case, single thread transactions-per-second remained same, but I saw consistent read I/O traffic on disks. So, this would probably work on systems, that have spare I/O (e.g. flash based ones).

Of course, as writes are already in multiples of 512 (and appears that memory got allocated just fine), I could try out direct I/O – it should avoid page read-in problem and not cause any memory pressure by itself. In this case switching InnoDB to use O_DIRECT was a bit dirtier – one needs to edit source code and rebuild the server, restart, etc, or…

# lsof ib_logfile*
# gdb -p $(pidof mysqld)
(gdb) call os_file_set_nocache(9, "test", "test")
(gdb) call os_file_set_nocache(10, "test", "test")

I did not remove fsync() call, but as it is somewhat noop on O_DIRECT files, I left it there, probably it would change benchmark results, but not much.

Some observations:

  • O_DIRECT was ~10% faster at best case scenario – lots of tiny transactions in single thread
  • If group commit is used (without binlogs), InnoDB can have way more transactions with multiple threads using buffered I/O, as it does multiple writes per fsync
  • Enabling sync_binlog makes the difference not that big – even with many parallel writes direct writes are 10-20% slower than buffered ones
  • Same for innodb_flush_log_on_trx_commit0 – multiple writes per fsync are much more efficient with buffered I/O
  • One would need to do log group merge to have more efficient O_DIRECT for larger transactions
  • O_DIRECT does not have theoretical disadvantage, current deficiencies are just implementation oriented at buffered I/O – and can be resolved by (in same areas – extensive) engineering
  • YMMV. In certain cases it definitely makes sense even right now, in some other – not so much

So, the outcome here depends on many variables – with flash read-on-write is not as expensive, especially if read-ahead works. With disks one has to see what is better use for the memory – using it for buffer pool reduces amount of data reads, but causes log reads. And of course, O_DIRECT wins in the long run :-)

With this data moved away from cache and InnoDB memory tax reduced one could switch from using 75 % of memory to 90% or even 95% for InnoDB buffer pools. Yay?

random poking

These are some of my notes from some sysbench in-memory r/o testing in past day or so:

  • At ‘fetch data by primary key’ benchmark with separate read snapshots at each statement, MySQL shines until ~200 concurrent threads, then performance starts dropping slightly faster than one would want, I think mostly from table cache LOCK_open contention
  • auto-commit cost (establishing read snapshot per statement) for SELECTs is ~10% for MySQL, but for PG it can be +50% in plain SQL mode and +130% (!!!!!!!) when using prepared statements (this can be seen in a graph – obviously the global lock PG has during this operation is held for too long and maybe is too costly to acquire.)
  • Some benchmarks went up by 10% when using jemalloc
  • MySQL could accept 10x more connections per second than PG (15000 vs 1500)
  • Most confusing behavior MySQL exhibited was at 100-record range scans in PK order:
    • At innodb_thread_concurrency=0 it did around 70k range reads, both fetching data and aggregation (SUM())
    • At innodb_thread_concurrency>0 it did only 10k range reads returning data but still was able to do 70k aggregations/s
    • PG was doing ~35k ops/s at that test

    It seems that at least for systems that do lots of range scans (or joins) I guess, managed concurrency kills performance entirely due to giving up tickets too often, need to review it more (Update: it seems that offending stack is ha_release_temporary_latches being called way too early in the select_send::send_data()).

%d bloggers like this: