catching top waits

Modern systems are complicated beasts with lots of interdependent activities between threads, programs and kernels. Figuring out some problems is nearly impossible without building some time machine and crystal ball mix that tells exactly what happened.

Did your cgroups CPU limit inject a sleep in the middle of mmap_sem acquisition by ‘ps’? Is everyone waiting for a mutex that is held by someone who is waiting for a DNS response? Did you forget to lock in your libnss.* libraries into memory and hence ended up stalling in unexpected place under memory pressure?

Continue reading “catching top waits”

MySQL does not need SQL

The “DBMS” part of MySQL is fine – storage engines (especially with new kids on the block), replication, etc, but it really sucks at executing SQL.

I won’t even get into complex SQL that has complex data dependencies, will start with very basic tasks.

SELECT * FROM table WHERE indexed = "A" LIMIT 1

If multiple indexes can satisfy the query, MySQL will hit each of them at least twice – looking up first “A” and last “A” records. It will do that while planning the SQL execution. Once it comes up with a plan, it will go and hit the index it picked again, this time once. So, if you have two candidate indexes, you will have 5 index accesses at 4 positions.

How would a direct cursor access work? Single index hit. Want to simulate that in SQL? You can add a ‘FORCE INDEX’ hint, then only one index will be considered, but still at two positions and you will have three index accesses. I wrote about this before.

This query:

SELECT * FROM table WHERE indexed IN (101, 201, 301) LIMIT 1

Would do six index dives during preparation as well (two for each IN position), plus another one during execution – seven dives when one would suffice.

What we learn from this is that whenever there’s an opportunity for lazy evaluation, MySQL will gladly miss it and do most work possible to run your query.

If you could express it yourself, you’d be lazy and you’d be efficient. It gets even worse if we start expecting something more advanced than a basic cursor positioning.

Whenever you’re doing a range scan on (a, b) indexed table:

SELECT * FROM table WHERE a BETWEEN 1 and 100 AND b=1234567 LIMIT 1

There’s an easy optimization given low-cardinality ‘a’ – you jump to each ‘a’ position and then you can do a dive for the ‘b’ value. In a way you can emulate this behavior with:

SELECT * FROM table
JOIN ( SELECT DISTINCT a FROM table ) x
USING (a) WHERE b=1234567 LIMIT 1

As I mentioned, MySQL will skip any opportunity to be lazy and in this case it will fully materialize all distinct ‘a’ values. If it were able to lazy evaluate, there’s a chance we can terminate the scan early.

We’re adding ability to skip-scan records in our builds (you can follow the work at https://reviews.facebook.net/D59877).

It is quite easy to describe whatever is needed in basic loop though – storage engines already provide with necessary hooks for these types of access methods.

Another basic single-table SELECT that fails with SQL is a standard “feed” query:

SELECT * FROM table WHERE category IN (5,6)
ORDER BY time DESC LIMIT 5;

MySQL will have to pick between two alternatives, one would be just scanning ‘time’ index and searching for specified categories among found rows, another is read all entries for each category, sort them all and return top 5.

Efficient way to execute such query would involve having per-category cursors and merging their reads, something like:

( SELECT * FROM table WHERE category = 5 ORDER BY time DESC LIMIT 5 )
UNION ALL
( SELECT * FROM table WHERE category = 6 ORDER BY time DESC LIMIT 5 )
ORDER BY time DESC LIMIT 5

MySQL is unable to merge these two cursors without writing all the data into temporary file and sorting it – although we already are reading much smaller datasets than with alternative naive (and readable) query. Besides, each subselect will open a table handler with all the associated buffers and if you want to merge hundred cursors you’re looking at hundred open tables.

You can do this operation efficiently in bash (with ‘sort -m’), it isn’t that complicated algorithm in any scripting language, but having such access method in MySQL’s SQL doesn’t seem likely.

Even where MySQL is already doing efficient loose scan (like in indexed-based GROUP BY), there were basic bugs open for years where efficiency would go down the drain simply because a LIMIT is added.

There’re quite a few other limitations in access methods that are quite annoying to work around. For example a query like this one:

SELECT * FROM table ORDER BY priority DESC, time ASC

Would be unable to use a regular index on (priority, time) – it can only walk everything in one direction and cannot have mixed order scans that are trivial to implement in basic procedural algorithm (move cursor to lowest time of lower priority, read all records for that priority in ascending order before repositioning the cursor to even lower priority).

Of course, one can change the direction of an index, or even have multiple indexes on same columns just to get an ordered read efficient. But none of that is needed if there’s a proper access method that can be used by SQL execution.

Directional index hints may be needed just to specify common order (e.g. prefix compression in RocksDB makes one direction cheaper than the other, although both still much cheaper than full blown filesort).

Even basic single order traversal breaks if you’re joining two tables:

SELECT * FROM t1 JOIN t2 USING (b) ORDER BY t1.a, t1.b, t2.c

In some cases I (*shudder*) had to use ‘FORCE INDEX’ without an ORDER BY to pick a direction I needed. One could expect basic functionality like ordered JOIN traversal to be part of SQL package.

There’re various other issues related to JOINs – again, in the best tradition of MySQL, lazy evaluation of joins is not possible – it will gladly do more work than you’d ever need, reading from tables you did not ask for.

These things slowly slowly change with each version, and to get basic things right we have to yell a lot. Hurray, 5.7 may finally have fixes for issues we were working around back when 5.x series did not exist) – but that is just way too slow for an SQL layer to evolve.

MySQL employs many bright engineers many of whom are trying to make better cost decisions on same existing limited set of access methods they use, by spending more cycles and adding more and more overhead.

In order to execute various queries one has to either resort to network roundtrips after each row or over-fetch data all the time. You may suggest stored procedures, but their data access is limited to running SQL queries and returning them as multiple result sets (or buffer everything in temporary table). Amount of deferred work and lazy evaluation you can do in a stored procedure is quite limited and overhead of running many SQL statements within a procedure is high.

Ability to access data via lower level interfaces by high performance server-side language (Lua? JS?) would allow to circumvent many many many limitations and inefficiencies of existing SQL optimizer and execution layer while still allowing occasional SQL access, high performance storage engines, replication and all the tooling that has been built to support MySQL at scale.

What do we do today? We run lots of that conditional logic in our application and absorb lots of the cost with a cache layer in the middle. There’s a chance that we would be able to spend less CPU, less I/O, less memory and less network resources if we could ask smarter queries expressed as procedures instead of wrangling all the relational algebra on top of dumb executor.

In some cases we have different database systems.

P.S. Many of the hypothetical scenarios map to workloads where amounts of data and query volume warrants all the optimizations I discussed here.

P.P.S. Other databases may have other set of issues.

linux memory management for servers

We’ve been learning for many years how to run Linux for databases, but over time we realized that many of our lessons learned apply to many other server workloads. Generally, server process will have to interact with network clients, access memory, do some storage operations and do some processing work – all under supervision of the kernel.

Unfortunately, from what I learned, there’re various problems in pretty much every area of server operation. By keeping the operational knowledge in narrow camps we did not help others. Finding out about these problems requires quite intimate understanding of how things work and slightly more than beginner kernel knowledge.

Many different choices could be made by doing empiric tests, sometimes with outcomes that guide or misguide direction for many years. In our work we try to understand the reasons behind differences that we observe in random poking at a problem.

In order to qualify and quantify operational properties from our server systems we have to understand what we should expect from them. If we build a user-facing service where we expect sub-millisecond response times of individual parts of the system, great performance from all of the components is needed. If we want to build high-efficiency archive and optimize data access patterns, any non-optimized behavior will really stand out. High throughput system should not operate at low throughput, etc.

In this post I’ll quickly glance over some areas in memory management that we found problematic in our operations.

Whenever you want to duplicate a string or send a packet over the network, that has to go via allocators (e.g. some flavor of malloc in userland or SLUB in kernel). Over many years state of the art in user-land has evolved to support all sorts of properties better – memory efficiency, concurrency, performance, etc – and some of added features were there to avoid dealing with the kernel too much.

Modern allocators like jemalloc have per-thread caches, as well as multiple memory arenas that can be managed concurrently. In some cases the easiest way to make kernel memory management easier is to avoid it as much as possible (jemalloc can be much greedy and not give memory back to the kernel via lg_dirty_mult setting).

Just hinting the kernel that you don’t care about page contents gets them immediately taken away from you. Once you want to take it back, even if nobody else used the page, kernel will have to clean it for you, shuffle it around multiple lists, etc. Although that is considerable overhead, it far from worst what can happen.

Your page can be given to someone else – for example, file system cache, some other process or kernel’s own needs like network stack. When you want your page back, you can’t take it from all these allocations that easily, and your page has to come from free memory pool.

Linux free memory pool is something that probably works better on desktops and batch processing and not low latency services. It is governed by vm.min_free_kbytes setting, which has very scarce documentation and even more scarce resource allocation – on 1GB machine you can find yourself with 5% of your memory kept free, but then there’re caps on it at 64MB when autosizing it on large machines.

Although it may seem that all this free memory is a waste, one has to look at how kernel reclaims memory. This limit sets up how much to clean up, but not at when to trigger background reclamation – that is done at only 25% of free memory limit – so memory pool that can be used for instant memory allocation is at measly 16MB – just two userland stacks.

Once you exhaust the free memory limit kernel has to go into “direct reclaim” mode – it will stall your program and try to get memory from somewhere (thanks, Johannes, for vmscan/mm_vmscan_direct_reclaim_begin hint). If you’re lucky, it will drop some file system pages, if you’re less lucky it will start swapping, putting pressure on all sorts of other kernel caches, possibly even shrinking TCP windows and what not. Understanding what kernel will do in the direct claim has never been easy, and I’ve observed cases of systems going into multi-second allocation stalls where nothing seems to work and fancy distributed systems failover can declare node dead.

Obviously, raising free memory reserves helps a lot, and on various servers we maintain 1GB free memory pool just because low watermark is too low otherwise. Johannes Weiner from our kernel team has proposed tunable change in behaviors there. That still requires teams to understand implications of free memory needs and not run with defaults.

Addressing this issue gets servers into much healthier states, but doesn’t always help with memory allocation stalls – there’s another class of issues that was being addressed lately.

I wrote about it before – kernel has all sorts of nasty behaviors whenever it can’t allocate memory, and certain memory allocation attempts are much more aggressive – atomic contiguous allocations of memory end up scanning (and evicting) many pages because it can’t find readily available contiguous segments of free memory.

These behaviors can lead to unpredictable chain of events – sometimes TCP packets arrive and are forced to wait until some I/O gets done as memory compaction ended up stealing dirty inodes or something like that. One has to know memory subsystem much more than I do in order to build beautiful reproducible test-cases.

This area can be addressed in multiple ways – one can soften allocation needs of various processes on the system (do iptables really need 128k allocation for an arriving segment to log it via NFLOG to some user land collection process?), also it is possible to tweak kernel background threads to have less fragmented memory (like a cronjob I deployed many years ago) or of course, getting the memory reclamation order into decent shape instead of treating it as a black box that “should work for you unless you do something wrong” (like using TCP stack).

Some of our quick changes (like net: don’t wait for order-3 page allocation) were addressing this case by case basis, but it was amazing to see that this kind of optimization was pulled in to cover many many more allocations via wide-reaching change (mm/slub: don’t wait for high-order page allocation). From my experience, this addresses huge class of reliability and stability issues in Linux environments and makes system behavior way more adaptive and fluid.

There are still many gray areas in Linux kernel and desktop direction may not always help addressing them. I have test-cases where kernel is only able to reclaim memory at ~100MB/s (orders of magnitudes away from RAM performance) – and what these test cases usually have in common is “this would happen on a server but never on a desktop”. For example if your process writes a [transaction] log file and you forget to remove it from cache yourself, Linux will thrash on the inode mutex quite a bit.

There’re various zone reclaim contract violations that are easy to trigger with simple test cases – those test cases definitely expose edge behaviors, but many system reliability issues we investigate in our team are edge behaviors.

In database world we exasperate these behaviors when we bypass various kernel subsystems – memory is pooled inside the process, files are cached inside the process, threads are pooled inside the process, network connections are pooled by clients, etc. Kernel ends up being so dumb that it breaks on a simple problems like ‘find /proc’ (directory entry cache blows up courtesy of /proc/X/task/Y/fd/Z explosion ).

Although cgroups and other methods allow to constrain some sets of resources within various process groups, it doesn’t help when a shared kernel subsystem goes into an overdrive.

There’re also various problems with memory accounting – although kernel may report you quickly how many dirty file system pages it has, it doesn’t give equal opportunities to network stack. Figuring out how much of memory is in socket buffers (and how full these buffers are) is a non-trivial operation, and on many of our systems we will have much more memory allocated to network stack than to many other categories in /proc/meminfo. I’ve written scripts that pull socket data from netlink, try to guess what is the real memory allocation (it is not straightforward math) to produce a very approximate result.

Lack of proper memory attribution and accounting has been a regular issue – in 3.14 a new metric (MemAvailable) has been added, which sums up part of cache and reclaimable slab, but if you pay more attention to it, there’s lots of guessing whether your cache or slab is actually reclaimable (or what the costs are).

Currently when we want to understand what is cached, we have to walk the file system, map the files and use mincore() to get basic idea of our cache composition and age – and only then we can tell that it is safe to reclaim pages from memory. Quite a while ago I have written a piece of software that removes files from cache (now vmtouch does the same).

Nowadays on some of our systems we have much more complicated cache management. Pretty much every buffered write that we do is followed by asynchronous cache purge later so that we are not at the mercy of the kernel and its expensive behaviors.

So, you either have to get kernel entirely out of your way and manage everything yourself, or blindly trust whatever is going on and losing efficiency on the way. There must be a middle ground somewhere, hopefully, and from time to time we move in the right direction.

In desktop world you’re not supposed to run your system 100% loaded or look for those 5% optimizations and 0.01% probability stalls. In massively interconnected service fabrics we have to care about these areas and address them all the time, and as long as these kinds of optimizations reach wider set of systems, everybody wins.

TL;DR: upgrade your kernels and bump vm.min_free_kbytes :-)

on removing files

If you remove a file, file system generally just marks in its metadata that previously occupied blocks can now be used for other files – that operation is usually cheap, unless the file has millions of segments (that is such a rare case, only seen in experimental InnoDB features that Oracle thought was a good idea).

This changes a bit with SSDs – if you update underlying device metadata, it can have smarter compaction / grooming / garbage collection underneath. Linux file systems have ‘discard’ option that one should use on top of SSDs – that will extend the life time of their storage quite a bit by TRIM’ing underlying blocks.

Now, each type of storage device will react differently to that, some of them support large TRIM commands, some of them will support high rate of them, some of them won’t, etc – so one has to take that into account when removing files in production environments.

Currently Linux block layer sees TRIM commands in same shape as write commands, so if you are truncating a terabyte, it is seen as a terabyte of write activity (and managed in similar fashion). That may make your writes (and/or reads) suffer.

Probably correct place to handle this better could be a file system – but it doesn’t have good feedback signals and doesn’t really have the job of I/O scheduling. Currently it does this data discard at the same place as it returns blocks – in a path that is expected to be fast, so it may hold file system transaction for a duration of this operation. This may or may not stall other file system activity at the time.

So now that we know that devices can be stupid, device drivers are stupid, block layer is stupid and file systems are stupid, we have to somehow address this issue. An obvious solution is to delete files slower.

Lots of performance engineering can be done by adding right sleeps into appropriate places – so one can do that to ‘rm’ too – it can sleep a bit after certain amount of bytes removed. What to do with large files? We have to slowly truncate them before we unlink them.

So I built a slower rm:

https://github.com/midom/slowrm

Usage:
 slowrm [OPTION...] PATH [PATH] ...

Help Options:
 -h, --help Show help options

Application Options:
 -r, --recursive Dive into directories recursively
 -c, --chunk=128 Chunk size in megabytes
 -s, --sleep=0.1 Sleep time between chunks
 -f, --force Continue on errors (by default bail on everything)
 -x, --one-file-system Only operate on one file system

We do what we got to do.

on political correctness

Wikipedia administrators received this letter (“Midom” is my username on Wikipedias):

Hi, I’ve nothing to do with any of this but passing through oc.wikipedia.org I have noticed someone who I presume to be some kind of admin, one Midom who seems to be rather lacking in social skills, judging by what’s going on here:https://oc.wikipedia.org/wiki/Discussion_Utilizaire:Midom

I think I appreciate the technical issues being dealt with in there, but his behaviour is way out of line and clearly oversteps what is considered acceptable today in any functional online community.

Especially when this behaviour is directed towards a group who are small and lacking in resources, but very enthusiastic, such as the Occitan Wikipedia lot, this is just plain bullying.

He has, very much without discussion or consultation, decided on the deletion of a significant amount of data–while the reasons appear legitimate, the way in which this was approached by Midom is lamentable (and this is a different discussion, but one could argue that if the templates under discussion lend themselves to be misused in the way they allegedly were, that doesn’t say much about the competence of the programmers involved so perhaps they, being a handsomely paid bunch these days, unlike the oc.wikipedia.org editors, should step in and find a solution to the problem. Just saying.)

So, for what little is left of Wikipedia’s credibility, I urge you to take action and:

  • Reprimand Midom for his reprehensible actions and attitude.
  • Admonish him to present his apologies to the Occitan Wikipedia community for his rude, aggressive, and unhelpful behaviour.

As I said, I personally have no axe to grind here, but I do not condone bullying.

I might as well add, having made a note of the information volunteered by this user in his user page, I do reserve the right to contact his employer and make them aware of his highly irresponsible behaviour and questionable social and technical competence. Midom, it is up to you to take this as a learning experience and make amends with the users you have inconvenienced and offended. Providing some assistance to the OC guys in migrating their data into a form that doesn’t clog up the servers wouldn’t go amiss either. — Preceding unsigned comment added by 83.47.182.89 (talk) 00:24, 23 April 2016 (UTC)

To this person who decided that my operational intervention (and resulting soap opera) back in 2012 was heavy handed, I appreciate your communication skills and eloquence. Extreme political correctness was not needed to operate Wikipedias back in the day. What I remember from that time is that there’d be always some crazies like you, and we had to deal with them in one way or another. Thats what being open and transparent means.

On the other hand, you can always blame me for everything, thats what Wikipedia’s Blame Wheel was invented for:blamewheel

on ORDER BY optimization

Generally in MySQL we send queries massaged to a point where optimizer doesn’t have to think about anything. In our major user database environment 99.9% of queries don’t have alternative query plans available (either because of forced indexes or just straightforward Primary Key read). We have various other systems and from time to time we have to do SQL work there and chase optimizer errors.

There’re multiple places where optimizer can make a choice in very basic queries, for example:

  • Which index returns less rows
  • Which index can be used for ORDER BY

A query that I was looking asked a very basic question, on a job instances table, show state and status for latest-by-ID entry for job name=’Ship Christmas Presents’ (real name was a bit different ;-). So, it was SELECT c,d FROM t WHERE b=X ORDER BY a DESC LIMIT 1, where PK is (a) and a possible index is on (b,c).

What we were observing was a massive table scan on PK instead of using (b, ...) indexing. Table in question was in hundreds of gigabytes, so that did hurt, a bit. If one forced the (b,c) index, queries became really fast. This wasn’t an issue with some intermittent statistics flapping.

The first thing that immediately caught my attention was that LIMIT 2 produced a proper query plan, whereas LIMIT 1 did not. I shipped a few-gigabyte sized subset onto my test machine and carefully went through what was happening.

EXPLAIN was just telling me that it will be picking bad query plan, EXPLAIN FORMAT=JSON was still telling the same, so I needed to look at some detailed execution data. MySQL has this extremely promising facility called ‘optimizer trace’, so I got the trace for my test-case. Unfortunately, the trace gave everything that I knew – that only one index made sense for reducing the dataset and that it changed to PK to order things better. It told me about number of rows and some “cost” of the plan – whatever those numbers mean, and it gave super-high numbers for table scan.

My optimizer trace did not tell why it decided to switch from decent query plan to absolutely horrible one, it just had a block telling that “reconsidering_access_paths_for_index_ordering” and that "plan_changed": true, which I already knew. On the other hand, that provided me with quick pointer into the source code – the six thousand lines of sql_select.cc. I could find above trace pointer somewhere in test_if_skip_sort_order(), which then calls this:

test_if_cheaper_ordering(..., order, table, usable_keys, ref_key, select_limit, &best_key, ...);

Essentially, this function will look at all the indexes that can be used instead of “filesort” and see what would happen if we used them. This function would say that the ref_key (b,c) – the index that returns least rows – is not the best key, and the best key is one on (a). How did it come up with such conclusion? Short answer – optimizer is very naïve.

That logic is explained in this comment:

/*
We assume that each of the tested indexes is not correlated
with ref_key. Thus, to select first N records we have to scan
N/selectivity(ref_key) index entries.
...
*/

It makes the naïve and somewhat optimistic calculation on (a) and the most pessimistic possible calculation on (b,c). I’ll start with the pessimistic one. Optimizer assumes that there’re 20000 instances for our job, and for each of these jobs we have to do a separate seek into PK, so our cost is 20000 (~300MB) for PK reads + few more reads on index itself.

Now the optimism (and bad query plan) comes from the idea that if we’re only selecting only 1 out of 20000 rows, that means only 0.005% of table scan is enough to satisfy LIMIT 1. If we would provide LIMIT 10, it would be only 0.05%. On a 100GB table, that means 5MB of data read, and that seems to be cheaper than the very pessimistic calculation of more than 300MB above.

Unfortunately, optimizer doesn’t understand, that there’re humans who are building these systems, and humans have their own rationale and thinking. One of the ideas that a human would have is that if you have 100GB table, you better understand things like data locality and other sorts of efficiencies. That means that in real world most of large tables have various degrees of correlation of data. In our fictitious example we know that “Christmas” happen, well, at Christmas. Looking through our window we know that it isn’t anywhere near Christmas.

So, database assumes that our data is distributed like this:

----W----H----E----E----E-----

When it is more like this:

-----------W-H-EE-EE----------

With this data distribution the pessimistic decision on (b,c) becomes way too dark and miserable – there’s a chance that “random” seeks into PK will all hit same pages, so we will need very few megabytes read. Our best case ends up being at ~5MB, our worst case is somewhere at above mentioned 300MB. Now optimistic decision can vary from “oh hey, I just started reading and found a row immediately” win of a lottery to “hey, I calculated an average for you” naïveté of 5MB to “oh snap, I was wrong” of say… 30GB.

Though we all agree that optimizer cannot everything, it errs into the direction of chasing much wider range of possibilities and being way more opportunistic rather than being somewhat more reliable. Obviously, it is very hard to tell whether changing some of these heuristics is possible in a way that would not affect million other places, but in this exact case we can look at what could be done better with information at our hand, either by rewriting queries or implementing somewhat procedural access.

One way is materializing the maximum ID first simply because it is already hidden in the (b,c) index – internally inside InnoDB that index is (b,c,a). So if we

SELECT MAX(a) FROM t WHERE b=X

we can get most of the data for the read just by scanning few index pages. We can use that data then to dive into primary key for that single row. Very similar approach can be taken with different limits.

We should also know that optimizer has most of this logic back from MyISAM times and it doesn’t know that it knows multiple values of (a) just by doing records-in-range estimation for (b,c) index – it does two random dives and it already observes primary key values. Simply by knowing that both of these values represent the range nowhere close the table scan head or tail it can discard the truly expensive query plan.

Of course, that is messy and can have broken sampling, but hey, it may be better than nothing, although it will again assume something opposite – that data is somehow correlated. Which we humans think it is and computer is on the opposite side of the fence.

So, in summary, you have to understand that database assumes things you don’t and sometimes you have to force your query plans or write your queries in a way that there’s no optimization space for optimizer left.

See also:

on time in mysql processlist

There was one MySQL feature that I was always very afraid to ask for. I sure needed it for past 15 years of my MySQL practice, and yet I never got to it. I wanted MySQL processlist (‘SHOW PROCESSLIST’, later – information_schema.processlist) to have more accurate query execution time.

I submitted a patch for that to MongoDB (and it got merged and released really quickly). I couldn’t admit to myself and others that MySQL does not have this functionality, even though it is hard to reason about systems in production without such data.

When 99.999% of queries happen within 1s, one has to resort to statistical analysis of zeroes and ones to determine how long they may be running (that is, if nine queries are at 0s and one is at 1s, there’s a chance that all of them are running for 0.1s). Unfortunately, this kind of statistical analysis is not feasible in runtime environment when dealing with issues at hand.

One of reasons why I did not submit this feature request is because I did not want to be subjected to the embarrassment of not understanding MySQL Release Cycles, Stability and Performance Architecture.

Someone else (Hi, Simon!) decided to ask for this in late 2014.
By 2015 spring MySQL engineering team responded with “thank you for your feature request”.
Few months later engineering team wrote that they won’t be improving tools like processlist and instead will change behavior of performance_schema tables (which were not useful at that time anyway).

So, even though MySQL already shows time based on arithmetics of subtracting query start time from current time, having the tiny improvement on top of that was not deemed the right way, because, I guess, it doesn’t fit the Performance Vision.

So, I’m confused. I’d like to see “SHOW PROCESSLIST” expanded to have this. Over time you learn the quirks and differences between it and I_S.PROCESSLIST that was added later in 5.1 (for example, one of them will truncate queries at zero-bytes, other will truncate queries at invalid unicode, even if data in queries is all binary). The whole truncation hierarchy of “SHOW PROCESSLIST” -> “I_S.PROCESSLIST” -> “SHOW FULL PROCESSLIST” deserves a separate discussion (rant?).

Enter Performance Schema. Assuming you don’t care about degraded performance of your MySQL environment you compiled it in.

It already has performance_schema.threads table, which has same second-level precision on the PROCESSLIST_TIME column. It has few additional columns over standard processlist although it has a very interesting behavior – it doesn’t show prepared statement texts in PROCESSLIST_INFO, so that information is truncated to 0 bytes (regular queries are truncated at 1024 bytes). So we have a third place to look for information, it was added in newer release, is Much Better (I don’t know in what way though) than existing INFORMATION_SCHEMA and SHOW options.

Apparently the real place to look at this (with bugs fixed in latest release) is performance_schema.events_statements_current.

Timing data is in picoseconds so everything has to be divided by a trillion to get a meaningful number. I can mentally handle microseconds or milliseconds, but dealing with 17-digit-numbers is not for my simpleton mind. This is not supposed to be used directly and one has to use specially built tools to access this data or write their own layers of views.

It won’t have user or schema information, so you’re forced to join to another table (threads or I_S). The sad part of this is that there’s no indexing/direct access methods provided and MySQL will use same methods as for any other non-indexed joins… The query would look something like:

select end_event_id, processlist_id id, processlist_user user, processlist_host host, processlist_db db, processlist_command command, processlist_state state, if(end_event_id is null,timer_wait/1000000000000,processlist_time) time, if (end_event_id is null, sql_text, NULL) info from events_statements_current right join threads using (thread_id) where type='foreground';

Now that I got to actual source of data I was wondering how useful it is in production environment. The answer is “not much”. Apparently if you have few hundred queries running MySQL will be writing to gigabytes of memory courtesy of Performance Schema SQL digests feature even with said feature disabled.
I filed a bug here, but was still confused.

It looks that the way to answer any idea how to improve MySQL DBA experience is by throwing in more expensive, buggy, complicated features, that are painful or impossible to use and wave a flag of “nobody complained but you”.

So I guess I can expose myself to more embarrassment, file same bug again. I really can’t believe that current implementation is supposed to be helpful and useful to DBAs. I guess someone does. Unfortunately, the only time they try their features is when they have to write a blog post how to use it.

P.S. We use either instrumentation on client side or our slocket – slow-log-datagram-socket – interface to do ad-hoc aggregations with high precision timings. I have no idea why we didn’t add direct high precision processlist ourselves.

See also:

how innodb lost its advantage

For years it was very easy to defend InnoDB’s advantage over competition – covering index reads were saving I/O operations and CPU everywhere, table space and I/O management allowed to focus on database and not on file systems or virtual memory behaviors, and for past few years InnoDB compression was the way to have highly efficient OLTP (or in our case – SGTP – Social Graph Transaction Processing) environments. Until one day (for some it came sooner, for others later)…

InnoDB team announced that it will change how it is going to do compression in the future and that old ways (that we rely on) will be all gone. I’m not exactly sure if there was any definite messaging on the future of existing methods, but Oracle in public will never put out a roadmap, and there’s lots of uncertainty involved then. Unfortunately, with this uncertainty, we probably lost quite some momentum in InnoDB engineering efforts (we don’t get to see some of planned advancements like Nizam’s work on page reorganization).

The new way is “InnoDB Transparent PageIO Compression” – and it makes lots of sense from full-stack architecture perspective. It relies on the fact that high end flash storage devices already have a log-structured block storage internally, and if one ties directly into it, lots of overhead can be avoided (similar concepts are used by MariaDB’s atomic writes).

We were throwing this idea around as a thought exercise years ago, and we mentioned it here and there. As every thought exercise, we had lots of pros and cons to think about.

One problem is that even it is log structured internally, it is still glued together out of blocks. Few years ago disks and flash devices used to be 512-byte formatted. Nowadays industry is switching to 4k sectors (on disks it yields higher density, on flash it reduces flash translation layer (FTL) costs).

If 16k compresses into 9k, earlier assumption was that new layer will write only 9k. With 4k sectors it will actually write 12k, oh no. How do we solve that with old-style compression? We only partially fill InnoDB’s page so that we will write 8k. In this case InnoDB deciding to be naive and not do any speculative page size management ends up writing much more than solutions used at large scale environments.

Another problem is that buffer pool is no longer compressed. This may mean you will need to buy devices with more IOPS and higher write endurance. Compressed buffer pool is huge advantage, and without it users will just have to spend more on hardware (and Oracle is in selling hardware business, yay!).

Then there’s this whole other thing, which makes absolutely no sense. Why would Oracle decide to support single hardware vendor (it doesn’t even own) proprietary solution in its ubiquitous open-source product. They say they’re using APIs that work elsewhere, but thats where it is recycled bovine manure.

When you’re talking to flash device, its FTL is hiding the fact that everything is truly fragmented underneath you and the namespace it has to deal with it does not have any complicated dependencies – it is essentially log-structured K/V store, where key is block address. The ease of log structured design is that you’re writing to very few places (and you’re usually appending). General purpose file system such as XFS has to handle all the metadata between underlying flat-addressed block device and directories, file placement, extents and writes to files. On top of that it has to provide semantics like file expansion, renames, deletion, all happening on that single block device underneath.

For quite a while InnoDB was holding a global mutex when extending files – and that is very trivial operation comparing to what hole punching would mean. Hole punching inside a file system would make each InnoDB page a separate segment that has to be tracked via file system metadata management (so every page write will be accompanied by filesystem journal and metadata writes). There is a question whether file system is going to scale, and then there’s just basic efficiency (a sparse synchronous write is ~5x more expensive than non-sparse one).

Dropping a file with millions of file system segments in it will take minutes of CPU time and lock contention on allocation group (each segment has to be evaluated, added back to list of free space segments with possible merging, etc). Understanding implications of extreme fragmentation (can you even use the file system once it hits 50% full? 75% full?) is not that straightforward either.

I did not have to think at all about file system scalability before (as long as writes got through), now I can’t stop noticing things like XFS padding log writes to a imaginary or real stripe size (as if every RAID is RAID5).

So while Oracle has completely messed up with InnoDB compression roadmap, surrounding industry moved ahead in leaps and bounds. Remember that toy MongoDB with all of its inefficiencies? This is where it is today:

Chasing benchmarks is not enough to win a datacenter, especially when large scale environments are working on improving efficiency of systems, not just throughput. RocksDB has been making its way into InnoDB’s turf in MySQL world, MongoDB ecosystem has RocksDB, TokuDB, WiredTiger. Embeddable InnoDB does not exist anymore, so most of innovation in storage systems ends up completely ignoring it.

While Oracle orients MySQL towards proprietary file systems and hardware devices, we will see more and more new platforms on top of open-source pluggable storage engines.

Though we did deploy recently some non-compressed InnoDB environments (I am going to talk at MySQL Conference about our MySQL/InnoDB Messenger backend), Yoshinori is going to talk about LSM databases at Facebook too and Harrison’s keynote will be about all the different systems that are needed to deal with complex data problems.

on io scheduling again

Most of database engines have to deal with underlying layers – operating systems, device drivers, firmware and physical devices, albeit different camps choose different methods.
In MySQL world people believe that InnoDB should be handling all the memory management and physical storage operations – maximized buffer pool space, adaptive/fuzzy flushing, crash recovery getting faster, etc. That can result in lots of efficiency wins, as managing everything with data problem in mind allows to tune for efficiency and performance.

Other storage systems (though I hear it from engineers on different types of problems too) like PostgreSQL or MongoDB consider OS to be much smarter and let it do caching or buffering. Which means that in top Postgres expert presentations you will hear much more about operating systems than in MySQL talks. This results in OS knowledge attrition in MySQL world (all you have to know is “use O_DIRECT, XFS and deadline scheduler”), yet Linux virtual memory behaviors and tuning are a constant issue where OS is allowed to cache or buffer.

This leads to very interesting behaviors – both PostgreSQL and MongoDB worlds have to deal with write starvation at checkpoint spikes – where no other operations can happen while data from dirty buffers is being written out to storage media. To help alleviate that instead of aiming to better managed I/O, they aim to keep less dirty pages in memory altogether. For example in Mongo world you will hear tuning recommendation to write out dirty pages once a second rather than once a minute (thus causing shorter stalls every second rather than system going dark every minute). Dirtying all the pages every second means that there is not much write merging going on and system is consuming expensive flash write cycles much faster than needed.

MySQL (and Flashcache) have demand driven checkpointing – pages are written out either if they are at the end of LRU and need to make space for fresh pages or too much log capacity is used and pages referred in oldest log events have to be synced. I prefer demand driven checkpointing much more as it means that system adapts to the workload and optimizes towards efficiency rather than performance workarounds.

So once I saw insert operations stalling for nearly a second in my tests on super-capable modern hardware (PCI-E flash, 144GB of RAM, etc), I started looking more at what can be done to eliminate such stalls. In order to be both efficient and not stall one has to do two things – reduce number of writes and prioritize important ones first. This is where the concept of “I/O scheduling” first comes to mind. As there’s lots of reliance on OS to do the right work, I looked at what exactly is being done.

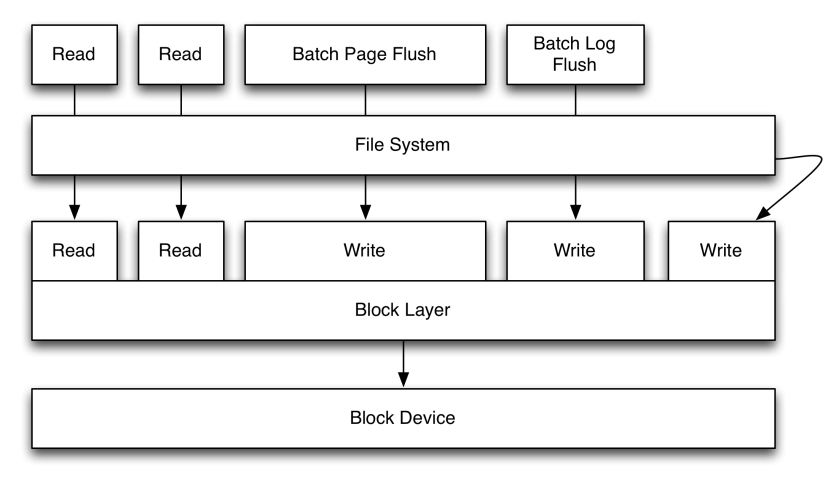
From overall general perspective database workload on I/O stack looks like this:

buffered block layer


Alright, I probably could’ve done a better job at making a diagram, but my main observations here are that block layer has no idea what files you are talking to, only page reads and writes coming from various sources (threads/processes), all coming to single block device. There are some other interesting issues. For example a dirty page write is attributed not to the thread that modified the page, but the one that decided to flush it (so it is either some variant of pdflush, or userland thread calling fsync() or msync()).

So, to properly schedule things we need to inform operating system better about our intentions. The standard in database world is deadline scheduler, which separates reads and writes into separate queues and thats about it – it does not try to distinguish different types of writes coming from different sources. CFQ is much more complicated and allows to put different threads into different classes (realtime, best effort or idle) and priorities. Unfortunately, even if I attribute workloads correctly with I/O scheduling properties I hit another issue:

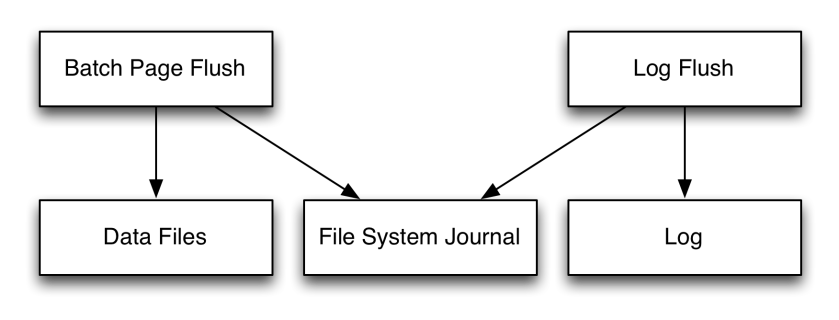
buffered block layer log


My two threads, one that has to get through ASAP in order not to stall system operations is actually stalling not because it cannot write its data soon enough, but because shared resource (file system journal) is being written (and delayed by scheduler) by idle or best-effort workloads.

There are two ways to deal with this, one is instructing file system to behave nicely and write its own journal with realtime scheduling, as otherwise it will stall other parts, or much simpler one – put transaction journal onto a separate file system (I can hear millions of “I told you so” voices, all forgetting that e.g. MongoDB does not even have configuration option where to put the journal and you have to hack your way around with symbolic links).

Obviously putting on completely independent device would also make sure that I/O scheduling is a non-issue too, but having multiple independent devices costs money, so we will have to still think about how to schedule things properly.

One would think that CFQ suddenly should be much more appealing as it allows to specify workload properties but the way it behaves is not exactly predictable. What one needs is much more straightforward rule set – don’t starve logs, don’t starve reads, allow other stuff to be drained eventually.

Technically, some of scheduling decisions can be simply be made by logical block addresses that get accessed (e.g. file system journal or DBMS transaction log) – and not by which thread is doing it – but interfaces to do that now are nonexistent.

There has been some interesting IO scheduler development at Taobao – they created FusionIO-oriented cgroups capable “tiny parallel proportion scheduler” for their MySQL workloads, that makes lots of sense in multi-tenant environments, but doesn’t yet address the problem of I/O starvation within same process that MongoDB has.

Currently if one wants to run Mongo or PG with perfect p99 (or pmax) behaviors, CFQ does not fully provide decent guarantees even with separate filesystems, and deadline is too limited in its scope. There should be more innovation in how user-land / file system / block layer cooperation should look like, rather than assuming that throwing hardware at the problem (or ignoring bad quality) is good enough.

That may be useful in InnoDB world some day too – I have seen issues where asynchronous batch write or read-ahead IO coming from many threads had capabilities to starve other workloads.

I tried some easy way out in some of the cases – currently MongoDB flushes one file at a time sequentially by calling msync() – which means up to 2GB flushes with default configuration or 512MB with “smallfiles” option. What one needs is much more predictable behavior, such as “flush 10MB at a time, wait for that to complete”. As it is not exactly tracked internally which pages are dirty and which are not, there is no way to provide that kind of throttling with current OS interfaces.

Though MongoDB already uses mincore() system call to check whether a page is cached in memory, there is no way yet to find out whether page is actually dirty (there have been LKML threads about providing that information). If there was an easy interface to get maps of dirty data from OS, database software would be able to schedule less aggressive writes without relying upon perfect I/O scheduler behavior.

P.S. Yes, I just blogged about MongoDB performance, albeit Mark Callaghan has been doing it for a while.