Now that writing code is cheap, I asked an LLM to implement something that I would’ve found useful in many different environments (and use programming language I rarely use). Say hello to poortrace.
In my (and my agents) daily work bpftrace is the best thing that has happened to Linux in for quite a while, but there’re still environments where it is not available. On this blog I’ve touched on dtrace, gdb, etc – but for past decade more and more work could be done with bpftrace. Unfortunately, it isn’t always available or the best choice. There’re various reasons:
- Containers and sandboxes – not everything has CAP_ADMIN or CAP_BPF, there may be seccomp profiles locking it down, etc. Kernels can be hardened and not allow injecting code into them (sometimes for good reasons!)
- bpftrace is quite heavy, needs kernel-side validation for generated code, etc.
- Kernels may be lagging and have no BPF support
- Impact from code inside the kernel can be frowned upon (I have deployed some bad stuff over the years)
In no way I would’ve thought that I can implement anything useful myself, but it is end of 2026 and few prompts later I had an interesting prototype: Rust, bytecode executed by LLVM, different sources of events – ptrace(), perf_event_open().
So, we have the script language, but instead of running the code inside the kernel, we just run it in the tracing environment itself, without ‘sudo’ and privileged access.
What can we do with it? CPU profiling is an easy start:
profile:hz:99 { @[ustack] = count(); }
It will use either native kernel unwinding, or DWARF, if frame pointers are missing.
But also:
- pystack – CPython 3.11-3.14
- jsstack – V8 frames from Node 20/22/24
- gostack – goroutines!
All that done without modifying the programs (or kernel!) – and one tool for different languages – immediately with flamegraph and speedscope outputs.
The main feature though is function tracing:
$ ./poortrace -p $(pidof webserver) -e 'u:"*net/http*" { @[func]=count()}interval:s:1 { exit()}'@["net/http.(*Server).Serve.gowrap3"]: 2@["net/http.(*Server).trackConn"]: 4@["net/http.(*Server).trackConn.deferwrap1"]: 4@["net/http.(*conn).close"]: 2@["net/http.(*conn).finalFlush"]: 2@["net/http.(*conn).hijacked"]: 2@["net/http.(*conn).hijacked.deferwrap1"]: 2@["net/http.(*conn).serve"]: 2@["net/http.(*conn).serve.func1"]: 2@["net/http.(*conn).setState"]: 4@["net/http.(*onceCloseListener).Accept"]: 2
This run on ptrace breakpoints – uretprobe returns not just retval, but latency as well. args() can decode C signature from DWARF, args_native() also does it for Go and Rust. USDTs work too.
Memory access is async, but one can run –reliable to run against stopped programs.
Everything can be packaged inside a single binary, with no external dependencies, that can be thrown into various environments. The interesting part is how well it can be used with modern agents in investigations – there’re features to compare data, report in JSON, similar scripting dialect – that can work quite well for that.
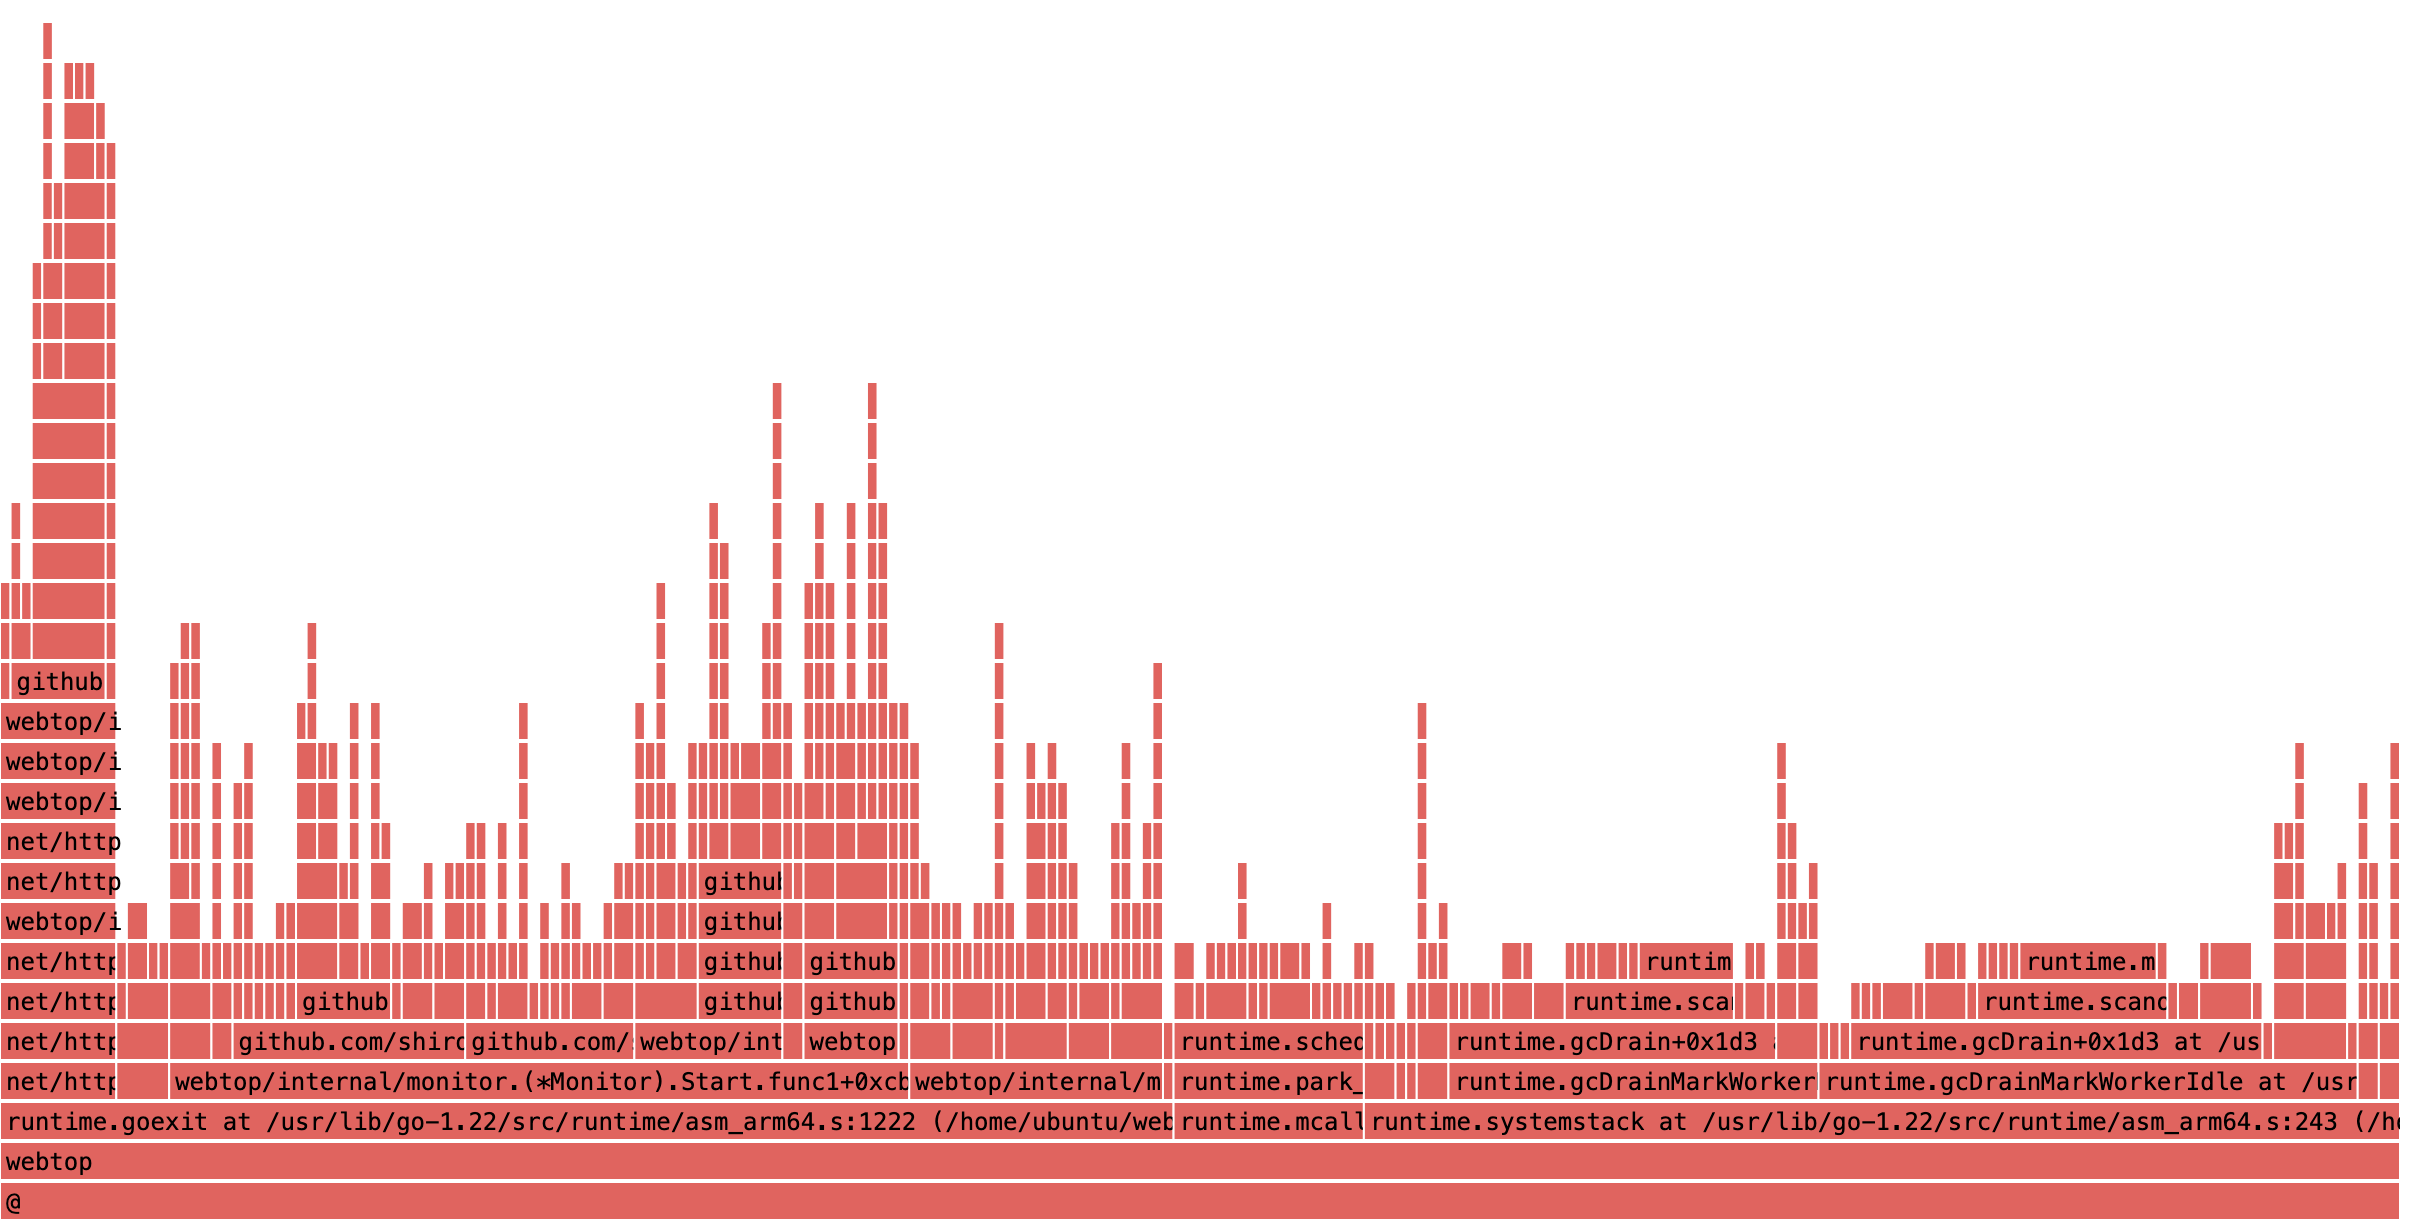
Some examples – this was generated directly:
./poortrace -p $(pidof webtop) -d 10 -e 'profile:hz:999 { @[comm, ustack(32)] = count(); }' --output-format flamegraph -o ~/www/cpu.svg
per-function latency distribution:
poortrace -p $PID -e 'ur:*http* { @lat[probe] = hist(latency); }'
Dynamic tracing works extremely well with agents as they can deploy trace points without having to push new instrumentation in the binaries – and with smaller performance impact than trying to achieve same with debuggers. Obviously, this doesn’t unseat bpftrace in capabilities, but it seems that some of the helpers and features I accidentlied into poortrace may be actually quite useful in other tooling too.
It may make sense to try to produce more complicated investigation flows using @globalmaps and /conditionals/ – and there’s a chance that the tool already does that. I haven’t really looked at the code.

